finder3
clear
close all
load filelist
nfile = 1;
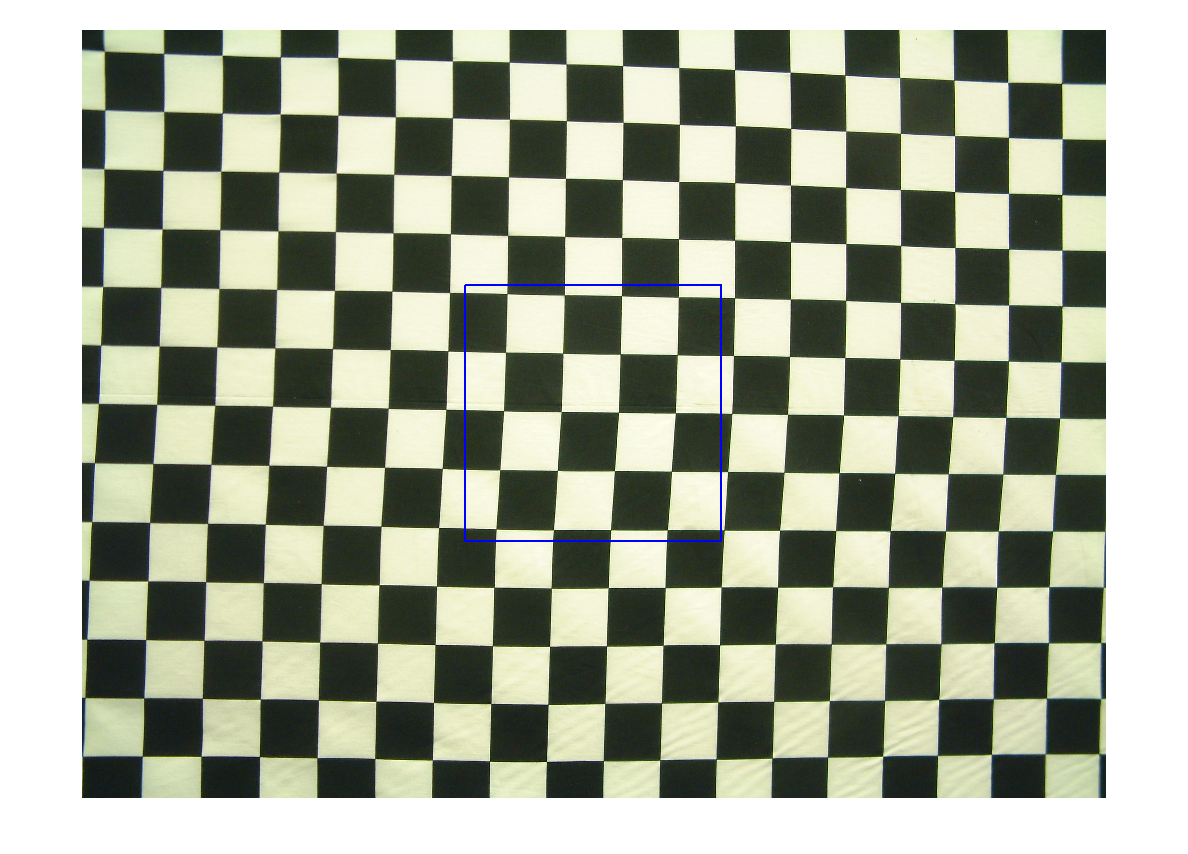
rgb = imread(files(nfile,:));
sz = size(rgb);
rect = [sz(2)/2-256 sz(1)/2-256 512 512];
warning('off','images:initSize:adjustingMag');
imshow(rgb);
hold on
xmin = rect(1);
xmax = rect(1)+rect(3);
ymin = rect(2);
ymax = rect(2)+rect(4);
plot([xmin xmax xmax xmin xmin],[ymin ymin ymax ymax ymin],'b','LineWidth',2);
hold off
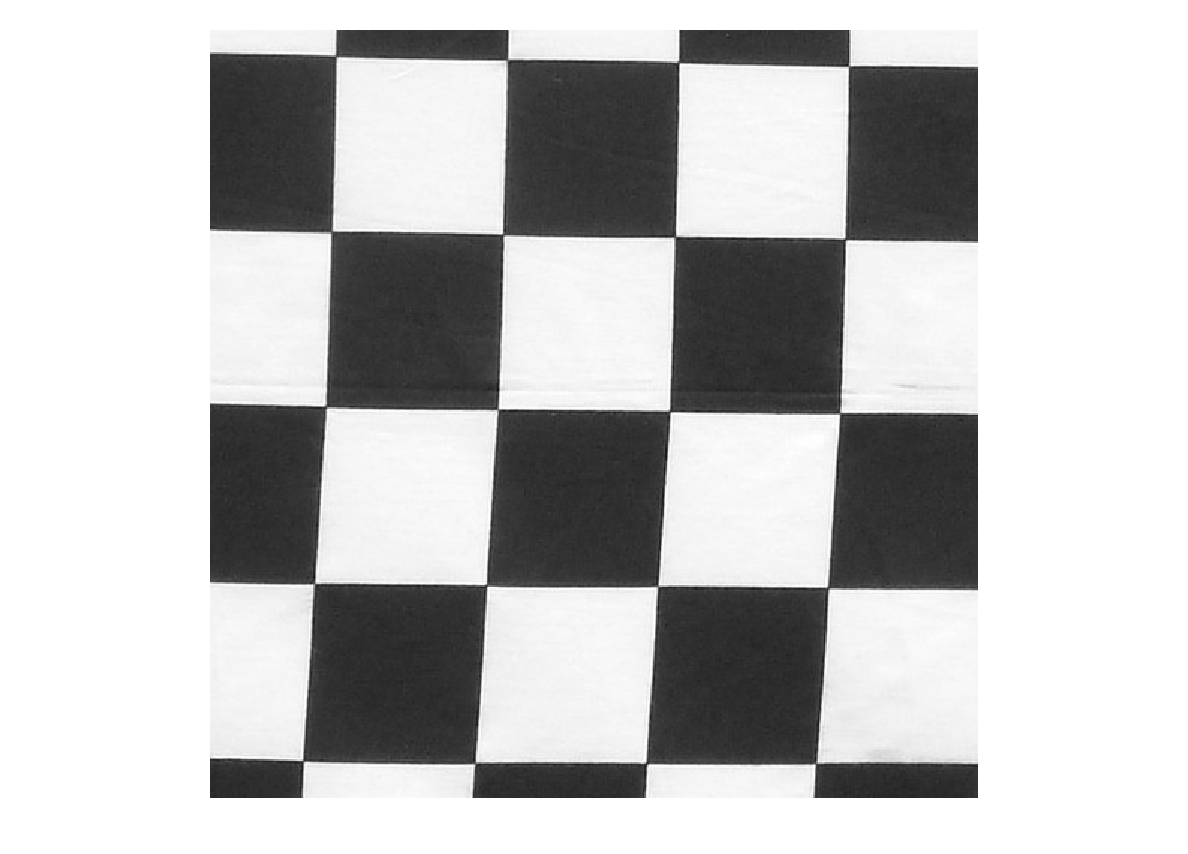
small = imcrop(rgb,rect);
g = rgb2gray(im2double(small));
imshow(g);
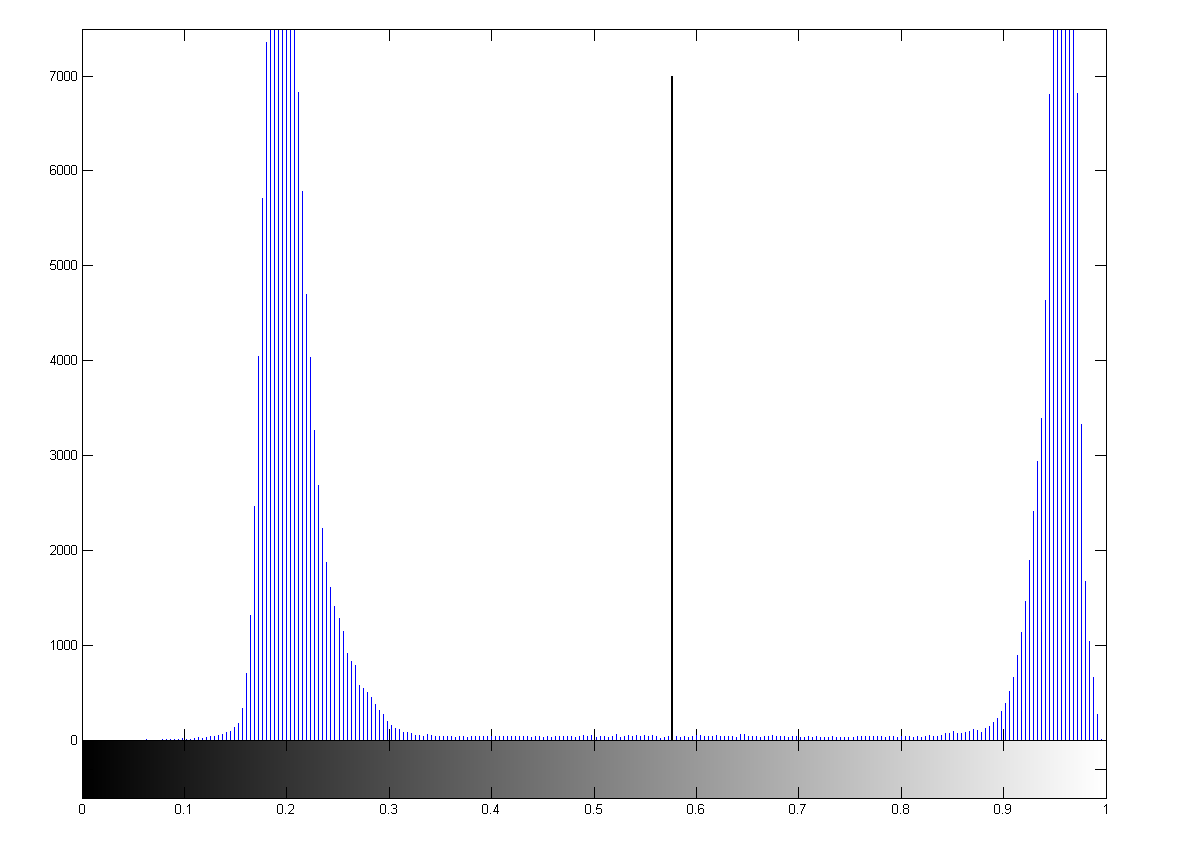
imhist(g);
bw_threshold = graythresh(g);
hold on
plot([bw_threshold bw_threshold],[0 7000],'k','LineWidth',2);
hold off
fprintf('threshold %g\n',bw_threshold);
threshold 0.576471
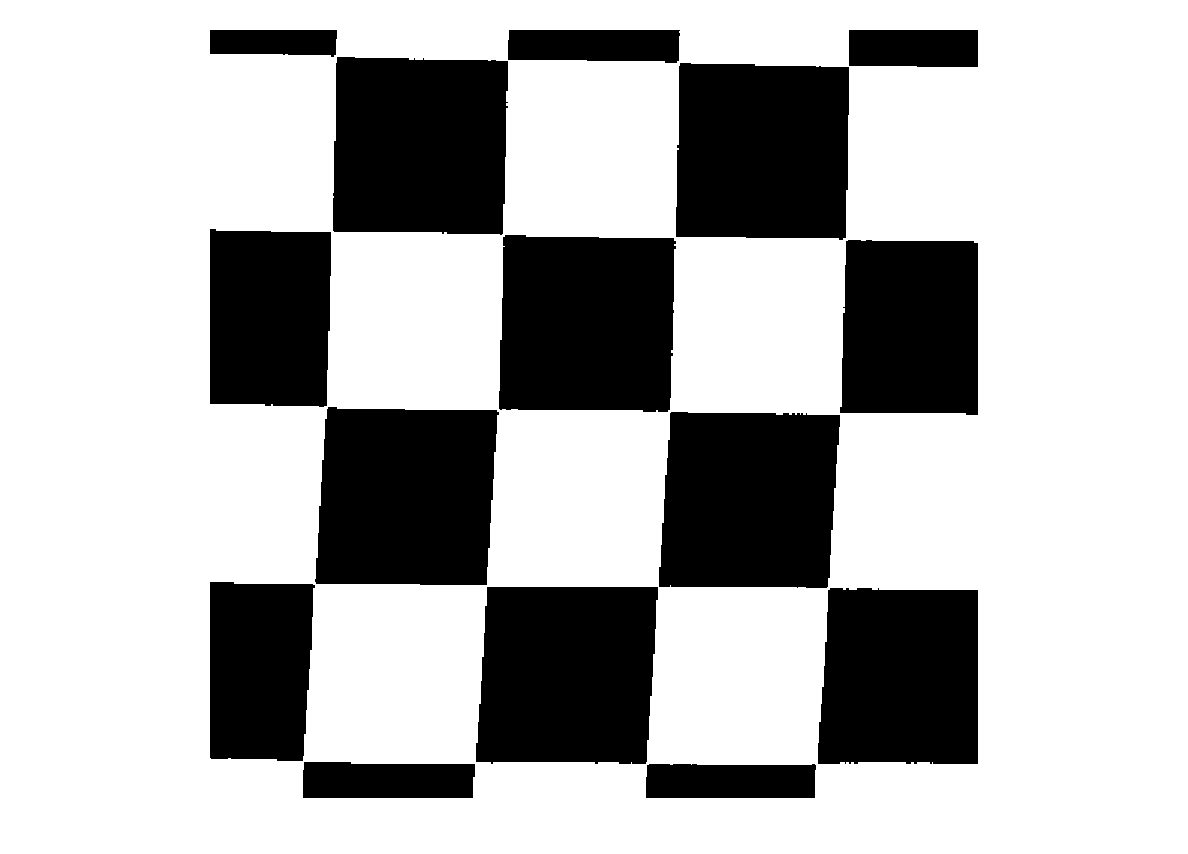
black = g<bw_threshold;
imshow(black);
white = g>bw_threshold;
imshow(white);
strel_width = 5;
se1 = strel('square',strel_width);
b1 = imdilate(black,se1);
w1 = imdilate(white,se1);
bw1 = w1&b1;
bw2 = bwareaopen(bw1,500);
imshow(bw2);
CC = bwconncomp(bw2);
disp(CC);
L = labelmatrix(CC);
imshow(label2rgb(L));
    Connectivity: 8
       ImageSize: [513 513]
      NumObjects: 1
    PixelIdxList: {[18874x1 double]}
s = regionprops(CC,'Image','FilledImage','Area','EulerNumber','BoundingBox');
euler = [s.EulerNumber]';
[eulermax, idx] = max(1-euler);
fprintf('max euler %g\n',eulermax);
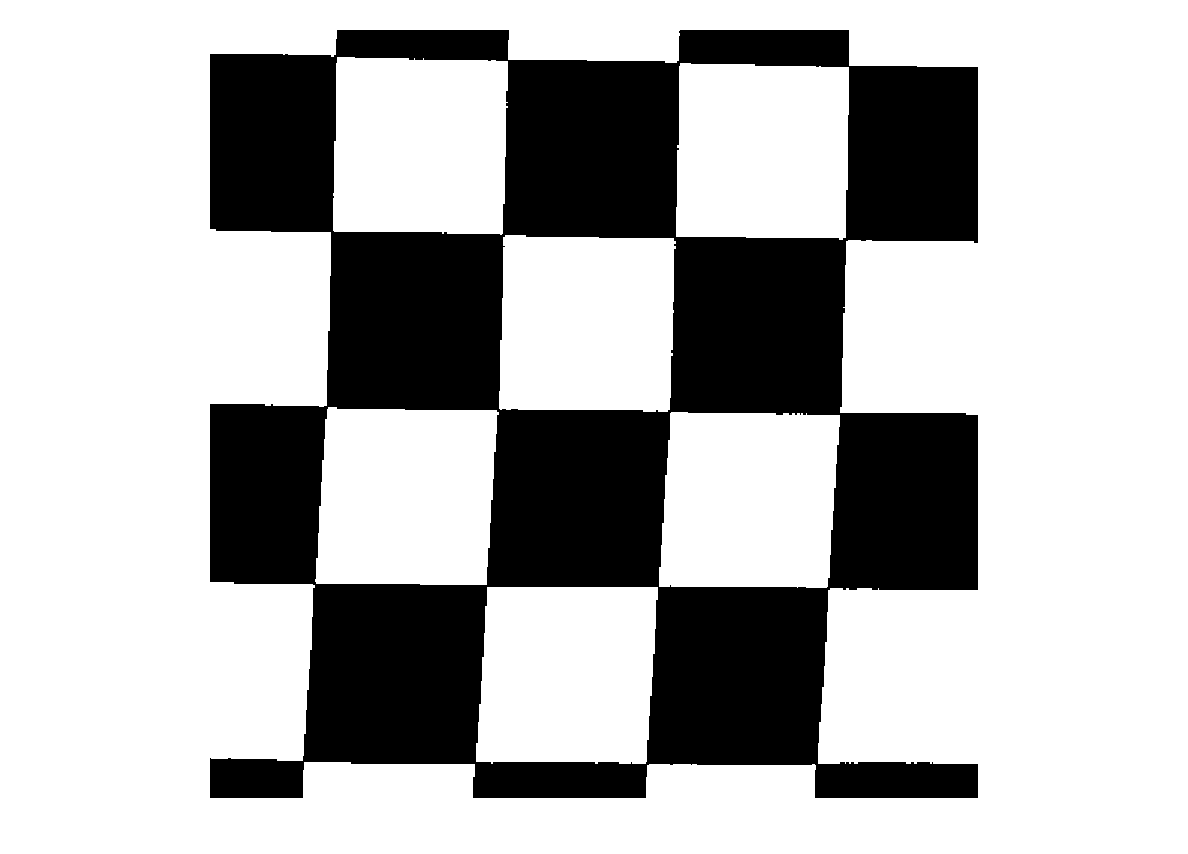
imshow(s(idx).Image);
max euler 12

s(idx)
bb = s(idx).BoundingBox
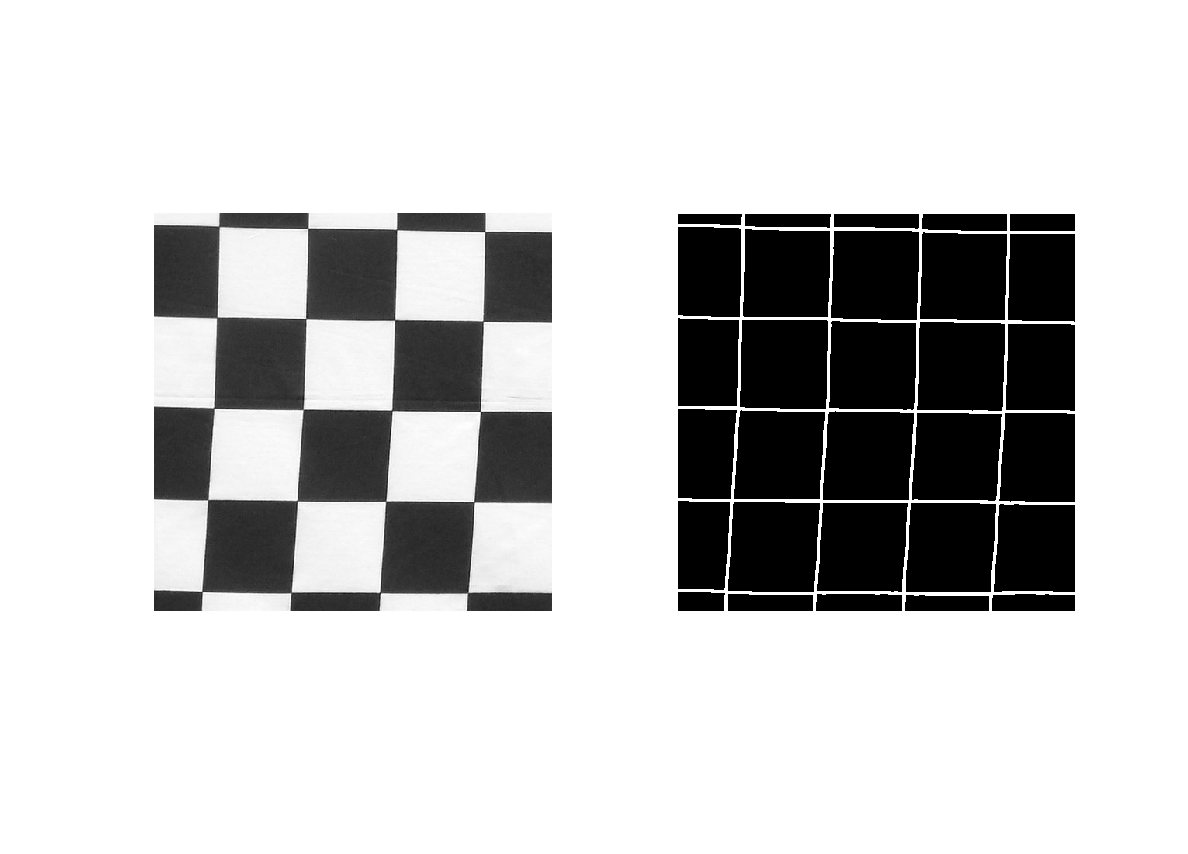
img = imcrop(g,floor(bb));
subplot(1,2,1);
imshow(img);
subplot(1,2,2);
imshow(s(idx).Image);
ans =

           Area: 18874
    BoundingBox: [0.5000 0.5000 513 513]
          Image: [513x513 logical]
    FilledImage: [513x513 logical]
    EulerNumber: -11


bb =

    0.5000    0.5000  513.0000  513.0000
close all;
sz = size(s(idx).Image);
nsquares = eulermax;
sqsize = ceil((sz(1)*sz(2))/nsquares);
fprintf('sqsize %g\n',sqsize);
small_area = min([floor(0.25*sqsize) 500]);
fprintf('small_area %g\n',small_area);
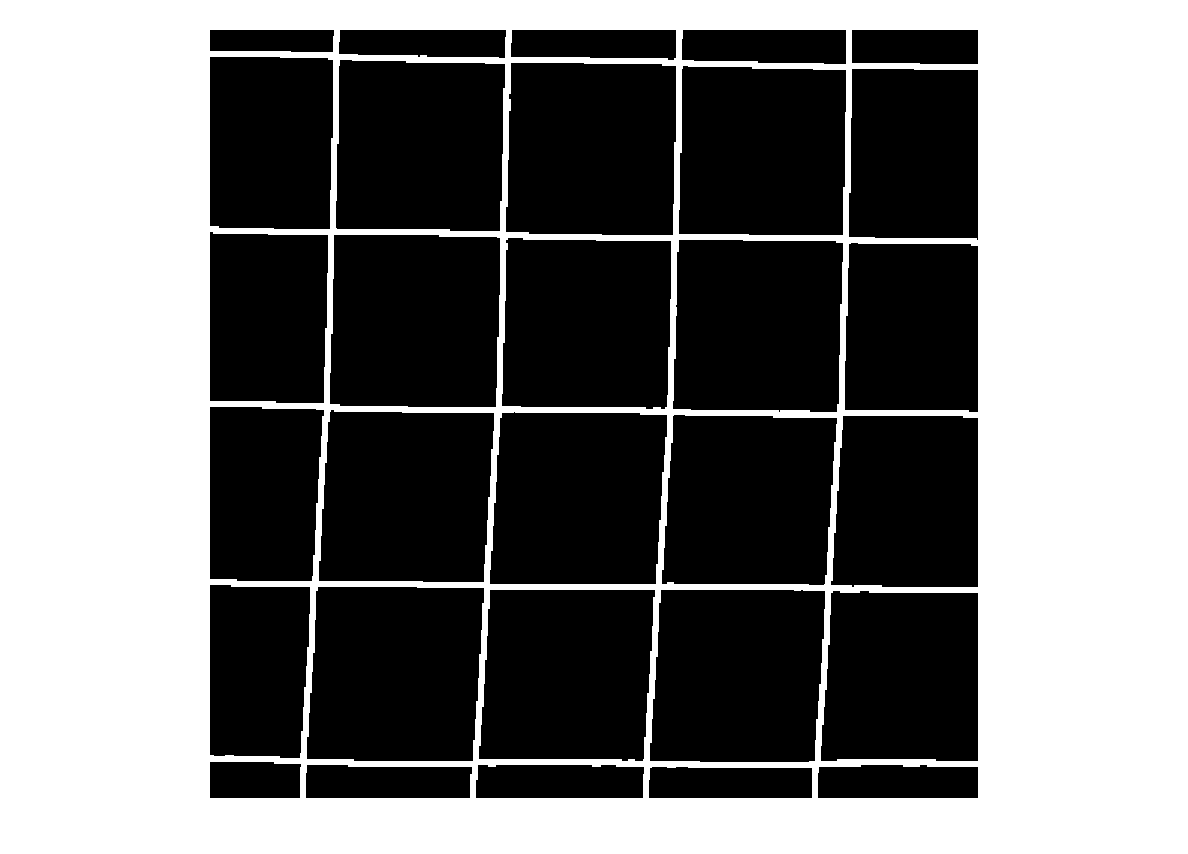
bw3 = s(idx).FilledImage&~s(idx).Image;
bw4 = bwareaopen(bw3,small_area);
CC2 = bwconncomp(bw4);
L2 = labelmatrix(CC2);
subplot(2,2,1);
imshow(img);
subplot(2,2,2);
imshow(bw4);
subplot(2,2,3)
rgbm = label2rgb(L2,'jet','k');
imshow(rgbm);
subplot(2,2,4);
mask = sum(rgbm,3)==0;
subplot(2,2,4);
gc = imcrop(g,bb);
if numel(gc)~=numel(mask)
diff = size(gc)-size(mask);
rect = bb - [0 0 diff(2) diff(1)];
gc = imcrop(g,rect);
end
gm = gc.*mask;
rgbn = cat(3,gm,gm,gm)+im2double(rgbm);
imshow(rgbn);
sqsize 21931
small_area 500
s2 = regionprops(CC2,'Area','Eccentricity','Centroid');

area = cat(1,s2.Area);
maxarea = max(area);
fprintf('maximum area %g\n',maxarea);
kdx = find(area>0.5*maxarea);
fprintf('number of squares %d\n',length(area));
fprintf('number of fullsize squares %d\n',length(kdx));
fprintf('Euler %d\n',1-s(idx).EulerNumber);
maximum area 12831
number of squares 12
number of fullsize squares 12
Euler 12
close all
area = [s2.Area]'/maxarea;
ecen = [s2.Eccentricity]';
[ecen_sorted ndx] = sort(ecen);
plot(area,ecen,'ko');
axis([0 1 0 1]);
grid;
xlabel('relative area');
ylabel('eccentricity');
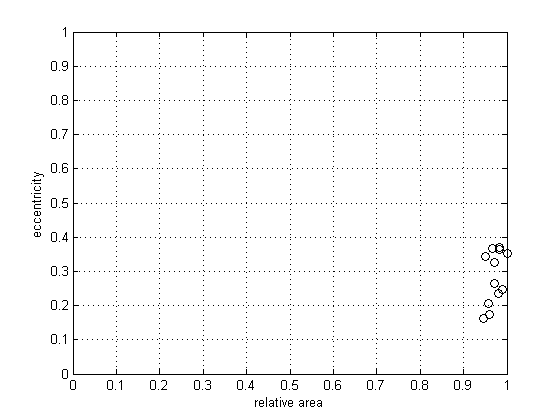
ndx = ecen<0.8;
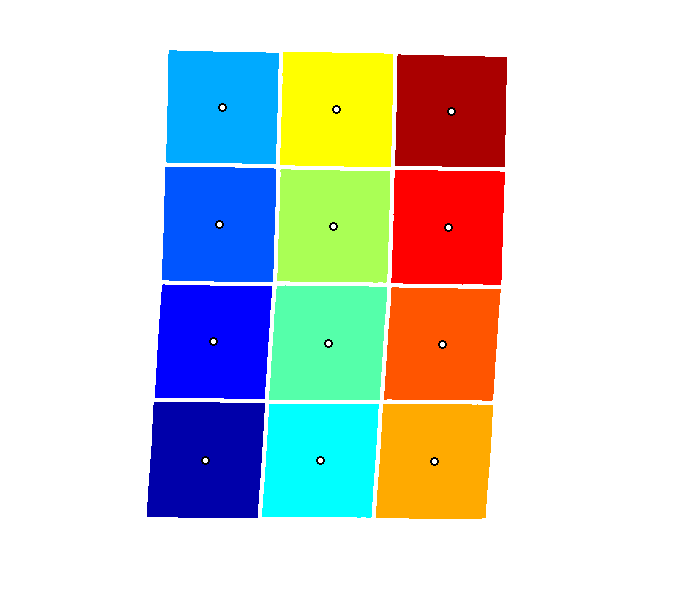
pts = reshape([s2.Centroid],2,length(s2));
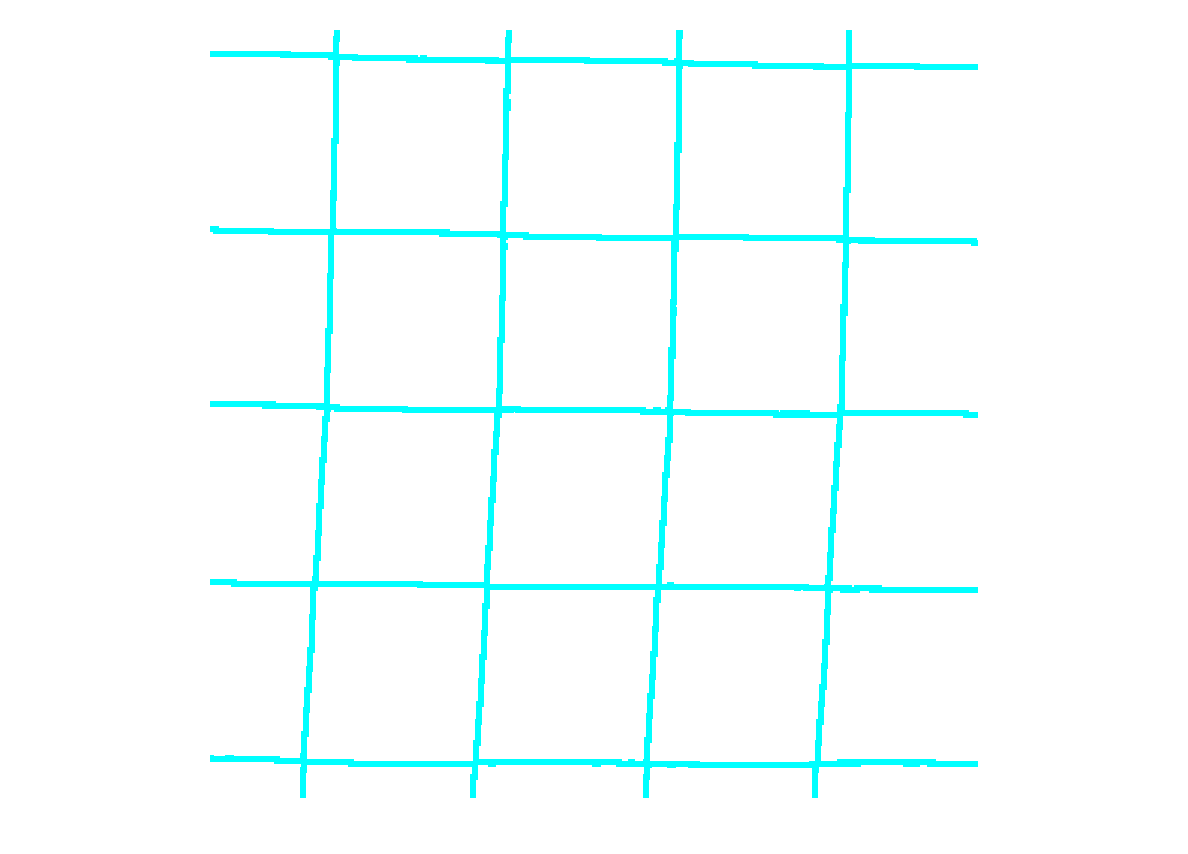
rgbc = label2rgb(L2);
imshow(rgbc);
pts = pts(:,ndx);
ecen = ecen(ndx);
hold on
plot(pts(1,:),pts(2,:),'ko','LineWidth',2,'MarkerSize',6,'MarkerFaceColor','white');
hold off
close all
rgbm = label2rgb(L,'jet','k');
mask = sum(rgbm,3)==0;
gm = g.*mask;
rgbn = cat(3,gm,gm,gm)+im2double(rgbm);
imshow(rgbn);
xc = pts(1,:);
yc = pts(2,:);
xcen = mean(xc);
ycen = mean(yc);
fprintf('centroid %g %g\n',xcen,ycen);
distsq = (xc-xcen).^2+(yc-ycen).^2;
[tsort idx] = sort(distsq);
xcen = xc(idx(1));
ycen = yc(idx(1));
fprintf('center point %g %g\n',xcen,ycen);
distsq = (xc-xcen).^2+(yc-ycen).^2;
[tsort idx] = sort(distsq);
jdx = idx(1:5);
[xcorn nx] = sort(xc(jdx)-xcen,'descend');
[ycorn ny] = sort(yc(jdx)-ycen,'descend');
ndx = jdx(nx);
u = [xc(ndx(1))-xcen yc(ndx(1))-ycen];
ndy = jdx(ny);
v = [xc(ndy(1))-xcen yc(ndy(1))-ycen];
fprintf('u %g %g v %g %g\n',u,v);
width = norm(u);
height = norm(v);
fprintf('width %g height %g\n',width,height);
fprintf('tilt %g degrees\n',atan2(-u(2),u(1))*180/pi);
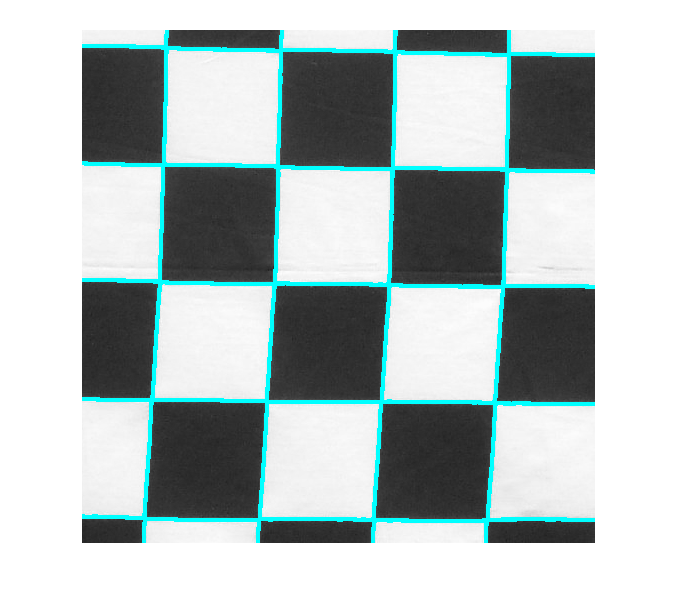
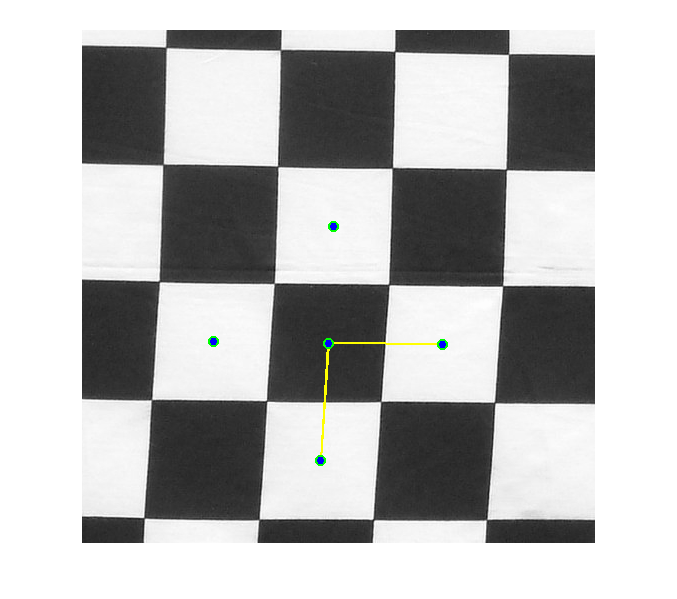
imshow(gc);
hold on
plot(xcen+[0 u(1)],ycen+[0 u(2)],'y','LineWidth',2);
plot(xcen+[0 v(1)],ycen+[0 v(2)],'y','LineWidth',2);
plot(xc(jdx),yc(jdx),'go','LineWidth',2,'MarkerSize',8,'MarkerFaceColor','blue');
hold off
centroid 248.183 255.269
center point 246.527 313.562
u 114.123 1.12323 v -7.45108 117.478
width 114.129 height 117.714
tilt -0.563905 degrees
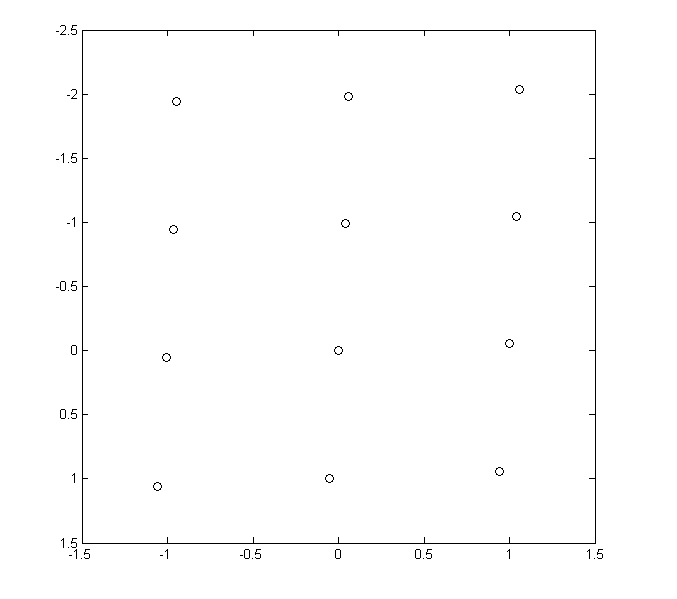
R = [u'/width v'/height];
npts = [(xc'-xcen)/width (yc'-ycen)/height]*R;
plot(npts(:,1),npts(:,2),'ko');
axis ij
f = int32(round(npts));
sz = size(f);
offset=-min(f)+1;
nc = int32(round(max(f(:,1))+offset(1)));
nr = int32(round(max(f(:,2))+offset(2)));
fprintf('rows %d columns %d\n',nr,nc);
occupied = zeros(nr*nc,1);
occupied(nr*(f(:,1)+offset(1)-1)+f(:,2)+offset(2))=1;
occupied = reshape(occupied,[nr nc])
occupied = zeros(nr,nc);
for k = 1:sz(1)
occupied(f(k,2)+offset(2),f(k,1)+offset(1))=1;
end
occupied
rows 4 columns 3

occupied =

     1     1     1
     1     1     1
     1     1     1
     1     1     1


occupied =

     1     1     1
     1     1     1
     1     1     1
     1     1     1
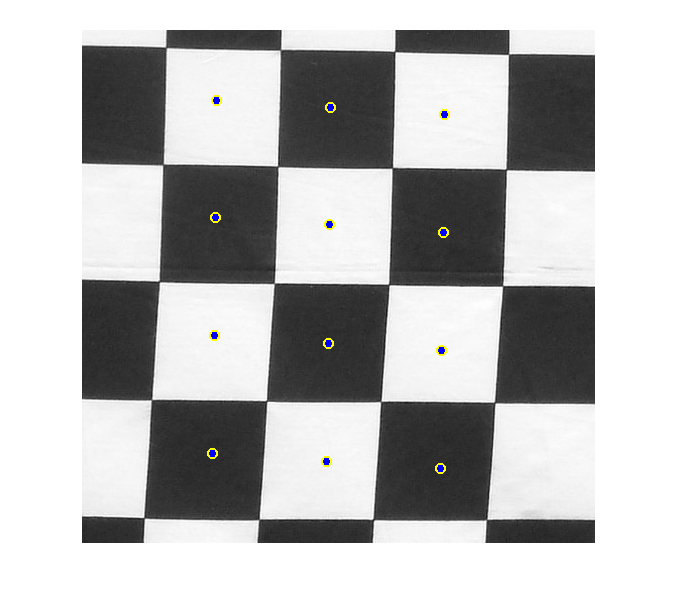
x = (1:nc)'-offset(1);
y = (1:nr)'-offset(2);
x = repmat(x*width,[nr 1]);
y = repmat(y*height,[nc 1]);
y = sort(y);
cpts = double([x y])*inv(R);
N = nc*nr;
imshow(gc);
hold on
plot(cpts(:,1)+xcen,cpts(:,2)+ycen,'yo','LineWidth',2,'MarkerSize',8,'MarkerFaceColor','blue');
hold off
warning('on');