Demo 4
Download MATLAB files: demo4.zip
This MATLAB script controls the function generator and oscilloscope to measure the response of an RC circuit to an input sine wave as a function of frequency.
The circuit under test is shown below.

The routine get_data.m uses the oscilloscope to measure the amplitudes of the input and output signals and the phase difference between input and output.
The autoscale function of the oscilloscope does not always work properly at low frequencies. The MATLAB code could be improved to detect and correct that situation.
Contents
Open function generator and scope
fg = gpib('agilent',7,10);
os = gpib('agilent',7,7);
fopen(fg)
fopen(os)
fprintf(fg,'*IDN?');
idn = fscanf(fg);
fprintf('function generator: %s',idn);
fprintf(os,'*IDN?');
idn = fscanf(os);
fprintf('oscilloscope: %s',idn);
clear idn;

% Set fg output load
fprintf(fg,'Output:Load INF');
function generator: HEWLETT-PACKARD,33120A,0,10.0-5.0-1.0
oscilloscope: AGILENT TECHNOLOGIES,54622D,MY40004759,A.01.50
take data
npts = 20;
freq = logspace(1,3,npts)';
y = zeros(npts,5);
for k=1:npts
    fprintf(fg,'FREQ %g',freq(k));
    y(k,:) = get_data(os);
end
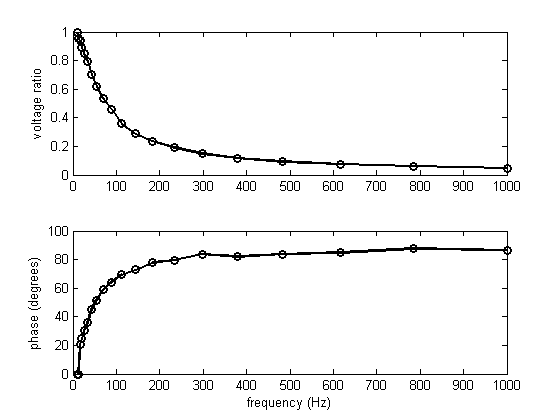
show data
subplot(2,1,1);
yratio = y(:,4);
yphase = y(:,5);
plot(freq,yratio,'ko-','LineWidth',2);
ylabel('voltage ratio');
subplot(2,1,2);
plot(freq,yphase,'ko-','LineWidth',2);
xlabel('frequency (Hz)');
ylabel('phase (degrees)');
look for 45-degree phase shift
idx = find(yphase>30 & yphase<60);
fz = interp1(yphase(idx),freq(idx),45);
fprintf(fg,'FREQ %g',fz);
get_data(os);
freq 42.37 Hz vratio 0.703514 phase 45 deg
compare time constant to RC
fprintf('time constant %g msec\n',1e3/(2*pi*fz));
R = 1000;
C = 3.55e-6;
tau = R*C;
fprintf('R %g ohms C %g uF tau %g msec.\n',R,C*1e6,tau*1e3);
time constant 3.75269 msec
R 1000 ohms C 3.55 uF tau 3.55 msec.
Close all instruments
g = instrfind;
for k=1:length(g)
    fclose(g(k));
    delete(g(k));
end
clear
close all