ECE303L Signals and Systems Lab 3
Objectives
- Learn how music uses frequency (pitch) and harmonics.
- Learn now to mathematically generate synthetic music.
- Investigate step function response of first-order (RC) circuits.
- Investigate AC response of RC circuits.
- Conduct an open-ended design project (resistance/capacitance measurement system)
Background
Download lab3 materials
The function tune.m can be used to produce some synthetic music,
illustrated in test_tune.m.
Each note of music will have an attack-decay-sustain-release envelope.
See lab notes for
more basic information about musical notes.
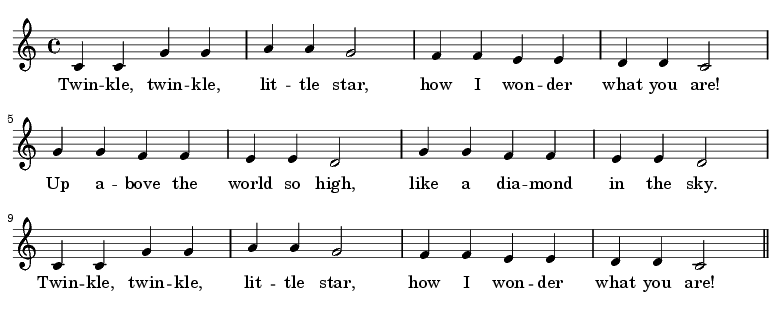
The notes produced by the tone function above are all the same duration. Real music,
like the example below, has notes of varying duration. Half-notes are twice as long as
quarter-notes.
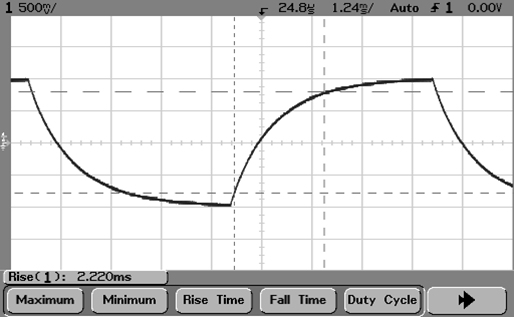
You have analyzed the following circuit in EGR203
If you set the frequency generator to a square wave at the appropriate frequency, you can
measure the rise and fall times, as shown below:
You should be familar with the AC characteristics of RC circuits.
You can measure the frequency response of the circuit, as shown in the
following link: frequency
response.
Requirements
- Generate a musical scale (C4 D E F G A B C5) (white keys) from sinusoidal tones
generated by tune.m. Plot the first couple of notes of the resulting
waveform and compare to a corresponding plot of an actual piano playing a sample C major scale.

- A song is a sequence of notes.
Use the following table of frequencies (or the tune function to
play the famous children’s song given by the
sequence of notes B A G A B B B. Identify the song.
| Note | Frequency
|
|---|
| G | 392
|
|---|
| A | 440
|
|---|
| B | 494
|
|---|
- Generate a piece of music (like Twinkle ...) with notes of varying length. You
may choose your own music, but include an image of the music score.
- Build an RC circuit like the one shown above. You can use substitution boxes or
discrete components. Measure the rise and fall time of your RC circuit.
Capture an oscilloscope image showing both rise and fall values.
Measure the
resistance and capacitance of your components using the impedance meter at the back of the lab.
Compare your measured values with the theoretical values.
- Measure the frequency response of your system, using a MATLAB script. You should obtain
measurements of frequency, amplitude of both channels, and phase shift. Plot the ratio of the
amplitudes (Vout/Vin) and the phase as a function of frequency. Superimpose a theoretical plot
over the experimental values. Choose a value for time constant τ
that gives the best match. Compare that value to that obtained from the impedance measurements.
- Exchange the position of the resistor and capacitor. Do the rise/fall times change?
Measure the frequency response of this system, as in the previous exercise.
- Design and test an automated system, using MATLAB, to determine the value of an unknown
capacitance or resistance. Note that the value of the unknown component may vary by many orders
of magnitude, and your system should "auto-range" in some fashion to account for this. There are
a number of potential ways of designing this system. The best system would be fast, accurate,
and high-precision (number of significant digits). The lab assistant will have you measure a
selection of unknown values to demonstrate your system.
Maintained by John Loomis,
last updated 28 September 2010