|
|
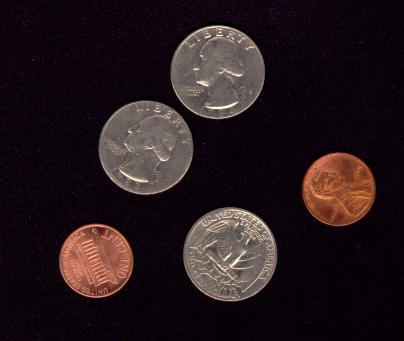
ģ rgb = imread('coins3.tif');
ģ gray = rgb2gray(rgb);
ģ imhist(gray);
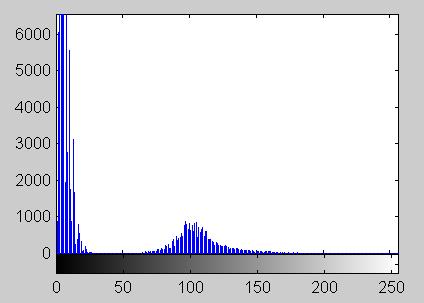
Use the histogram to choose a threshold that isolates the objects of interest. The image bw is a binary image.
ģ bw = gray>40; ģ imshow(bw); ģ imwrite(bw,'bw.jpg');
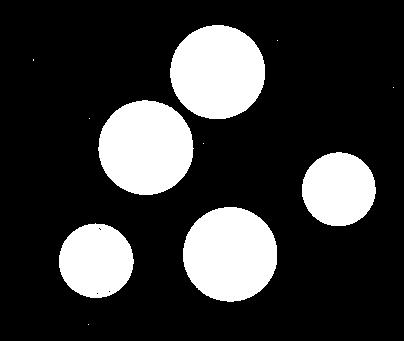
Use the Matlab function bwlabel to label the objects in the binary image. Display the results as an indexed image (with a pseudo-color colormap).
ģ [L,num] = bwlabel(bw); ģ num num = 11 ģ M = im2uint8(L/num); ģ imwrite(M,jet,'label.jpg');
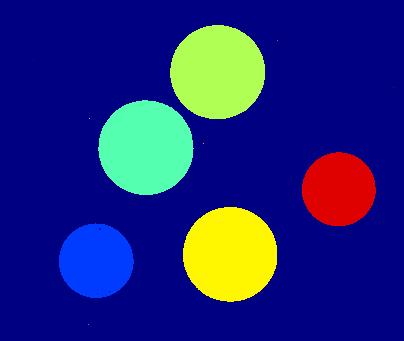
There are 11 objects, some of which are just stray pixels. Find the area of each object using the Matlab function bwarea.
ģ for i=1:num
area(i) = bwarea(L==i);
end
ģ area
area =
1.0e+003 *
Columns 1 through 7
0.0020 4.3670 0.0010 0.0010 7.0810 7.0396 7.0464
Columns 8 through 11
0.0010 0.0010 4.2916 0.0010
Find those elements whose area is large. These are the coins.
ģ x = find(area>5)
x =
2 5 6 7 10
ģ area(x)'
ans =
1.0e+003 *
4.3670
7.0810
7.0396
7.0464
4.2916
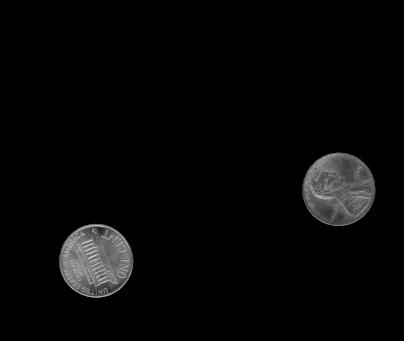
Select those objects representing the smaller coins (pennies). Mask these objects in the original grayscale image and display the result.
ģ M = (L==2)|(L==10); ģ imshow(M) ģ penny = im2double(gray).*M; ģ imshow(penny) ģ imwrite(penny,'penny.jpg');
Maintained by John Loomis, last updated 8 Feb 2000