script5
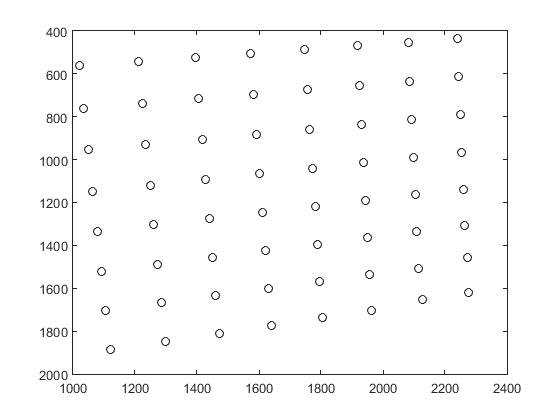
load Calib_Results

plot(x_1(1,:),x_1(2,:),'ko');
axis ij
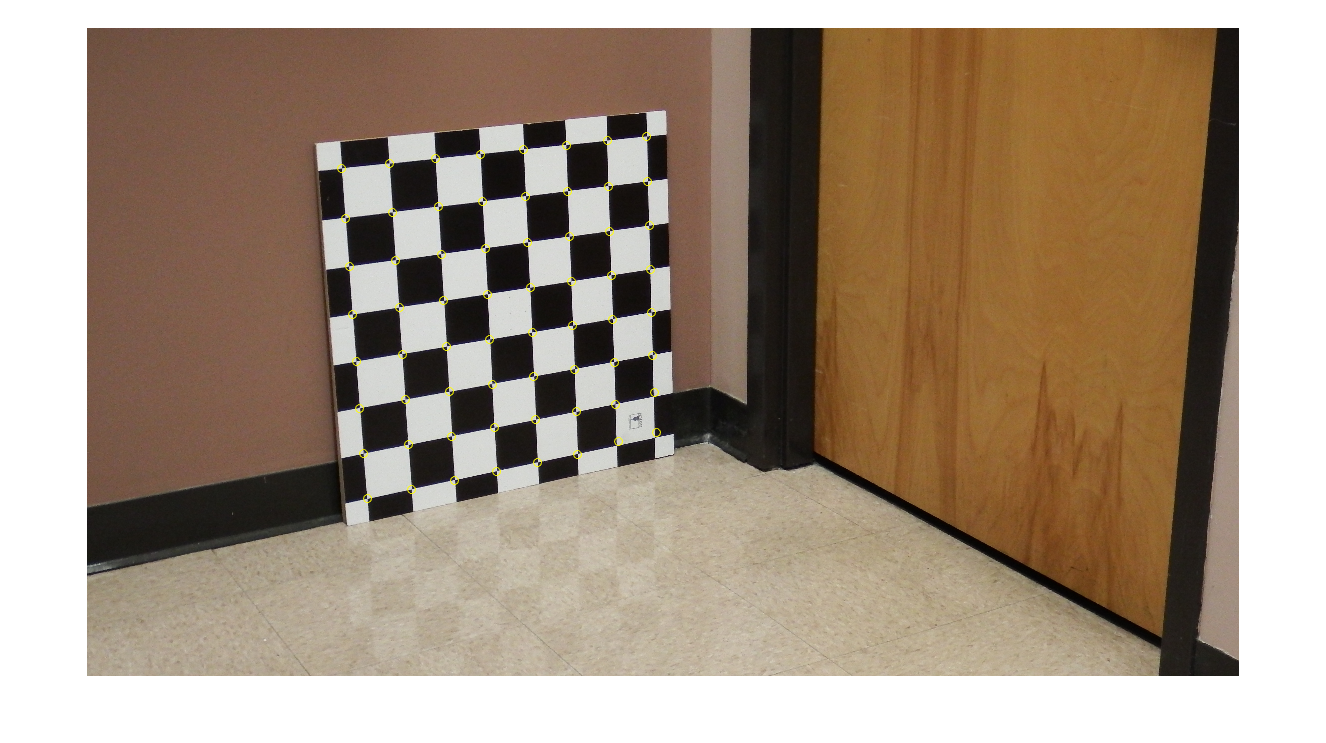
filename = [calib_name num2str(1) '.jpg'];
rgb = imread(filename);
imshow(rgb);
hold on
plot(x_1(1,:),x_1(2,:),'yo');
hold off
Warning: Image is too big to fit on screen; displaying at 25%