reproject_calib
Reproject on the images
% Color code for each image:

colors = 'brgkcm';

% Reproject the patterns on the images, and compute the pixel errors

if ~exist('dont_ask','var'),
   dont_ask = 0;
end;

if isempty(ima_numbers)
   ima_proc = 1:n_ima;
else
   ima_proc = ima_numbers;
end;
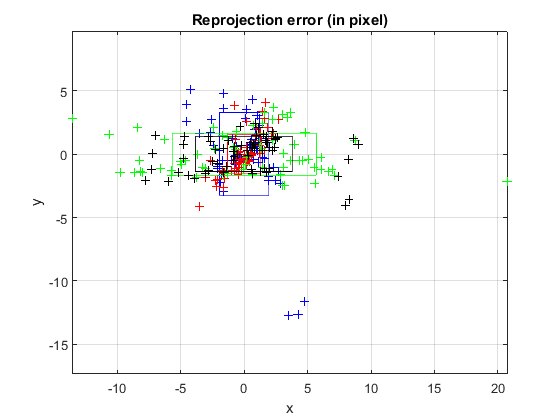
figure;
for kk = ima_proc
    if exist(['y_' num2str(kk)],'var'),
        eval(['expts = ex_' num2str(kk) ';']);
        ndx = rem(kk-1,6)+1;
        cstr = [colors(ndx) '+'];
        err_std = std(expts')';
        fprintf('Pixel error: [%3.5f   %3.5f] (Image %d)\n',err_std,kk);
        % plot errors
        plot(expts(1,:),expts(2,:),cstr);
        xr = err_std(1);
        yr = err_std(2);
        hold on
        % plot err_std box
        plot([-1 1 1 -1 -1]*xr,[-1 -1 1 1 -1]*yr,colors(ndx));

    end;
end;
hold off;
grid
axis('equal');
title('Reprojection error (in pixel)');
xlabel('x');
ylabel('y');
drawnow;
if n_ima==0,
    text(.5,.5,'No image data available','fontsize',24,'horizontalalignment' ,'center');
end;


set(gcf,'color',[1 1 1]);
set(gcf,'Name','error','NumberTitle','off');
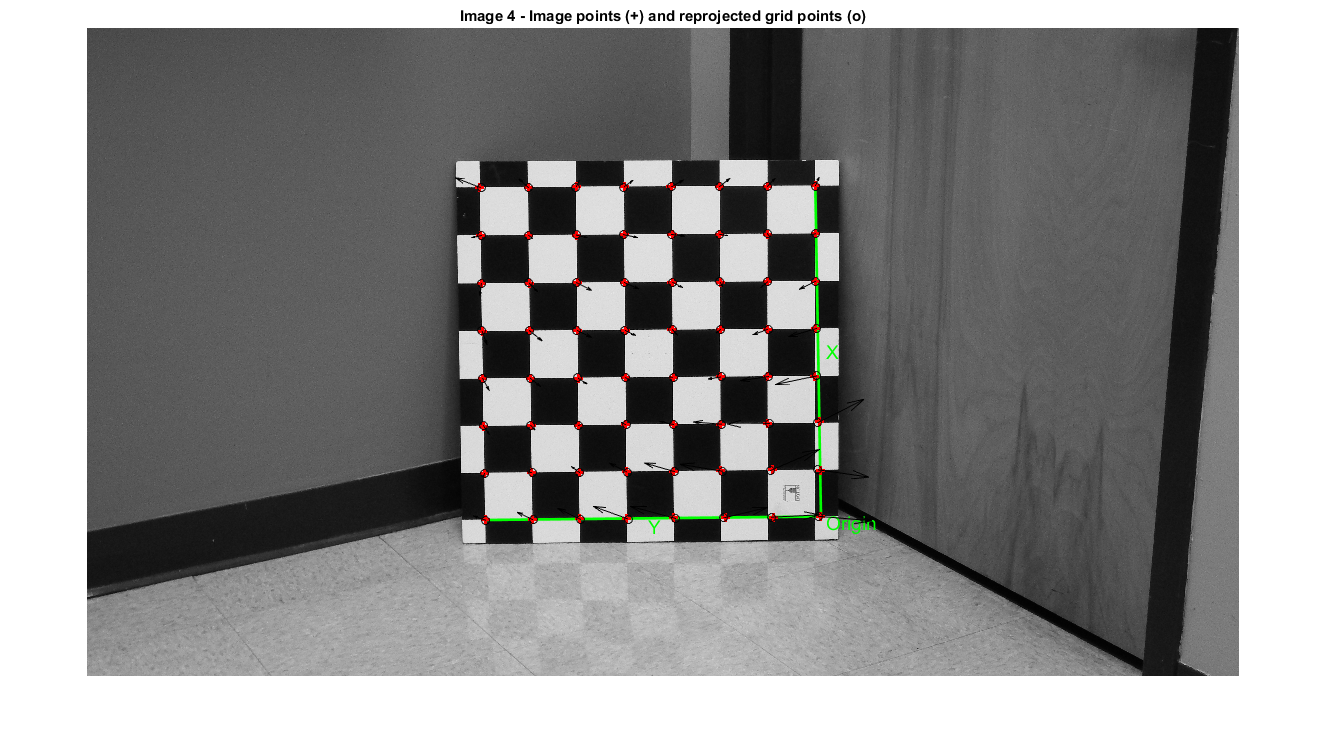
Pixel error: [1.95365   3.28618] (Image 1)
Pixel error: [1.32083   1.56940] (Image 2)
Pixel error: [5.68218   1.66049] (Image 3)
Pixel error: [3.83260   1.36648] (Image 4)
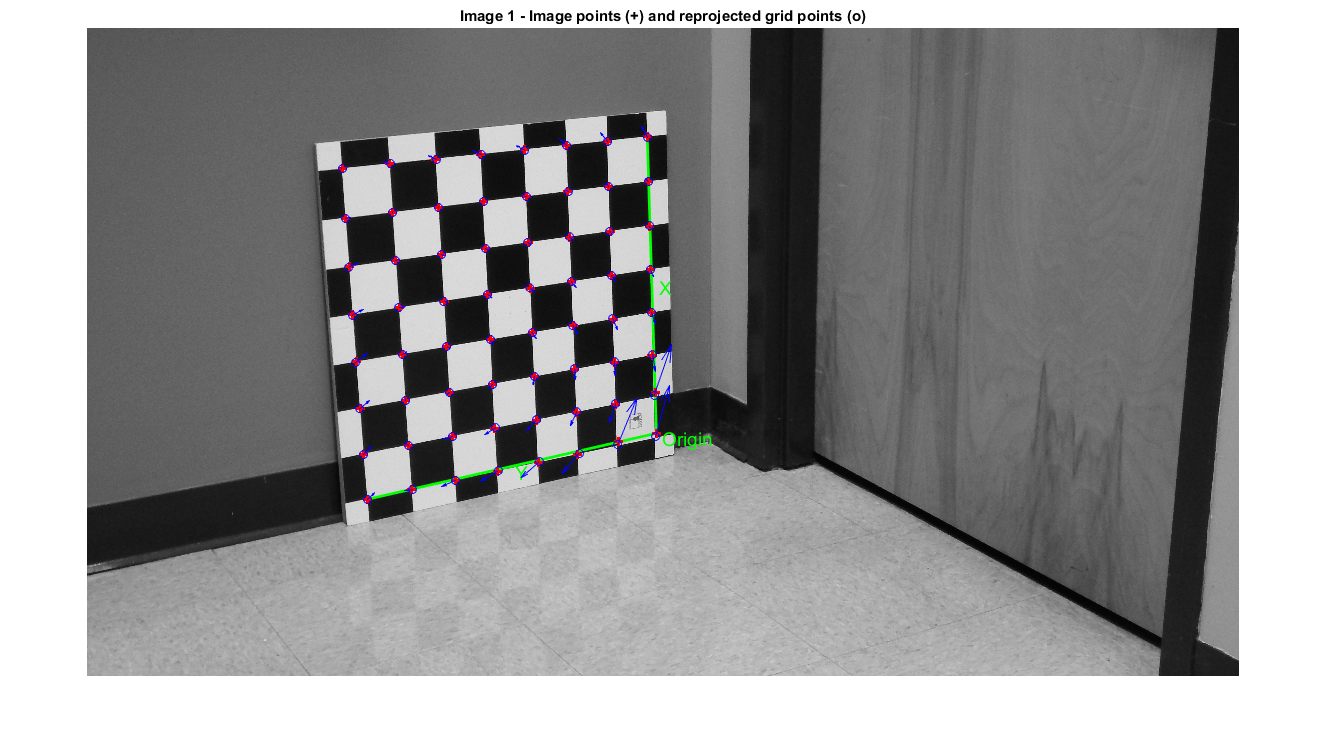
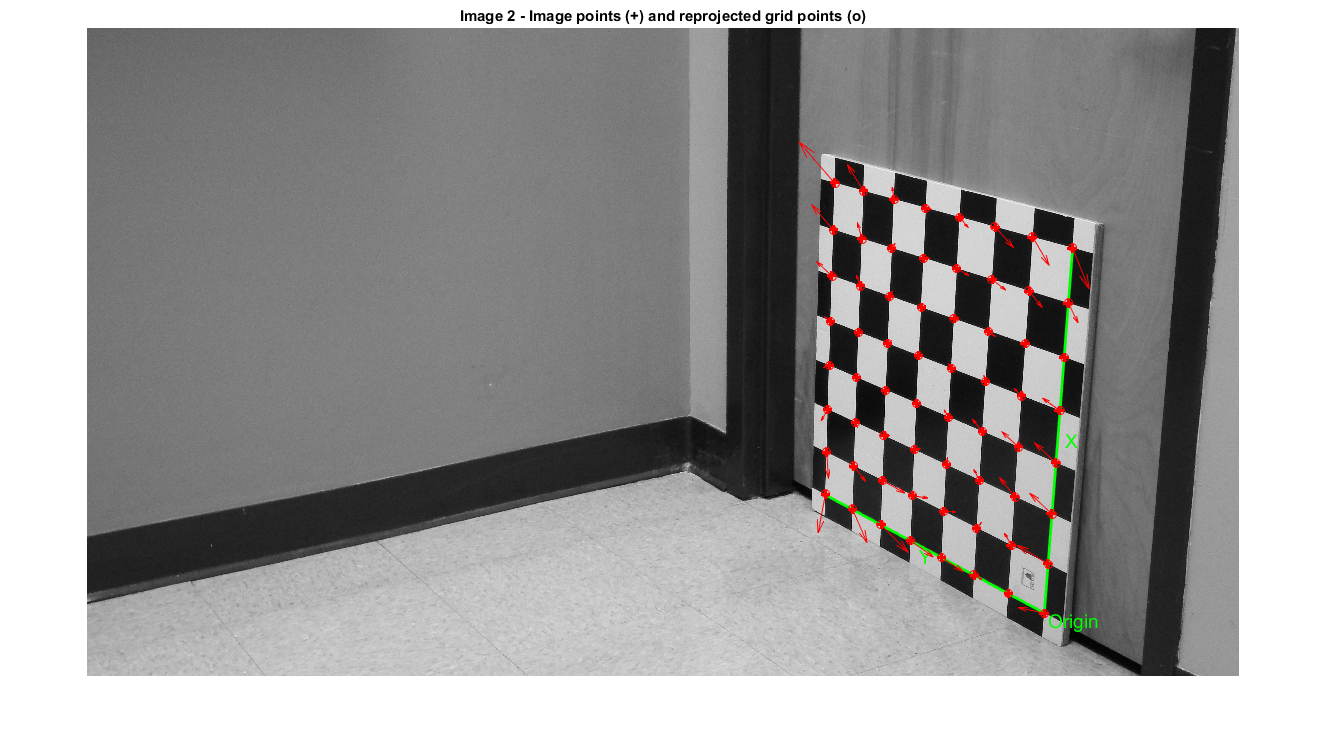
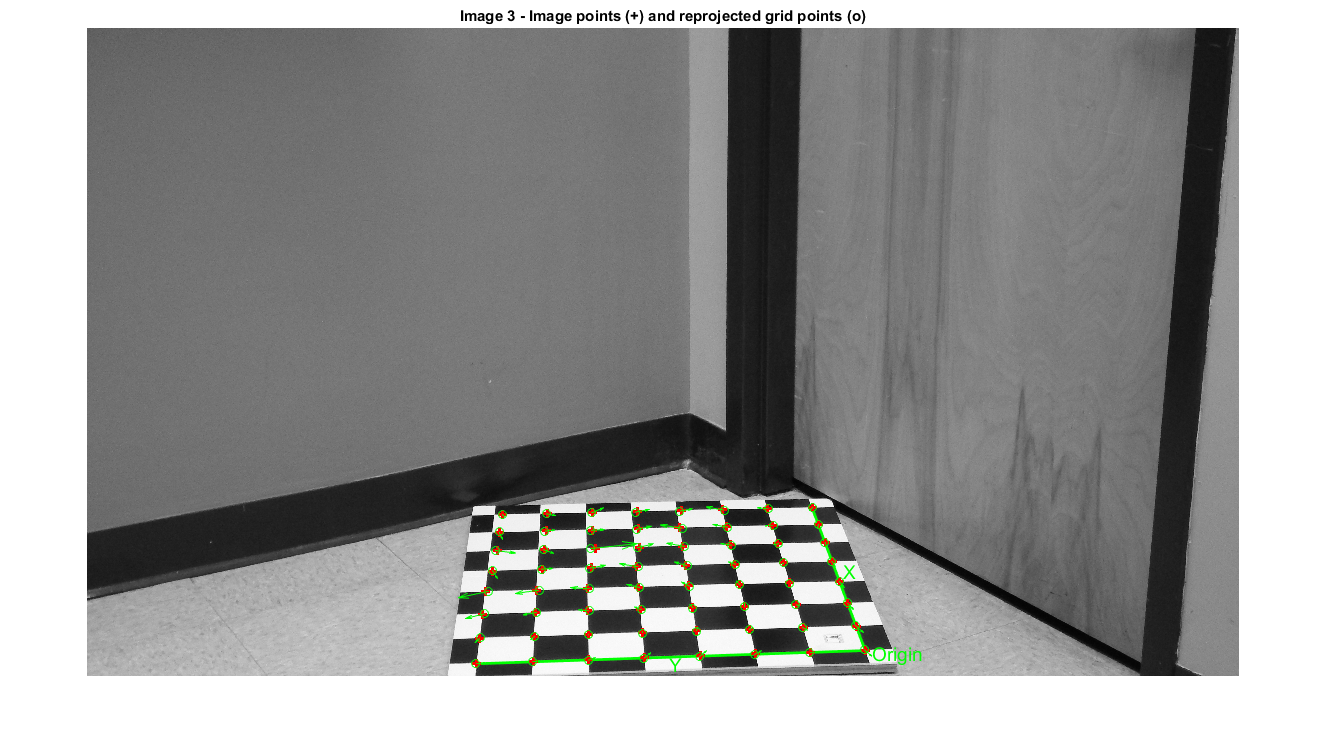
no_grid = false;

for kk = ima_proc,

    if exist(['y_' num2str(kk)],'var'),

        if exist(['I_' num2str(kk)],'var'),
            eval(['I = I_' num2str(kk) ';']);
        end;


        figure(5+kk);
        %             image(I); hold on;
        %             colormap(gray(256));
        imshow(I);
        hold on;


        if ~no_grid,

            eval(['x_kk = x_' num2str(kk) ';']);

            N_kk = size(x_kk,2);

            if ~exist(['n_sq_x_' num2str(kk)],'var') || ~exist(['n_sq_y_' num2str(kk)],'var'),
                no_grid = 1;
            end;

            if ~no_grid,
                eval(['n_sq_x = n_sq_x_' num2str(kk) ';']);
                eval(['n_sq_y = n_sq_y_' num2str(kk) ';']);
                if (N_kk ~= ((n_sq_x+1)*(n_sq_y+1))),
                    no_grid = 1;
                end;
            end;

        end;

        if ~no_grid,

            % plot more things on the figure (to help the user):

            Nx = n_sq_x+1;
            Ny = n_sq_y+1;

            ind_ori = (Ny - 1) * Nx + 1;
            ind_X = Nx*Ny;
            ind_Y = 1;
            ind_XY = Nx;

            xo = x_kk(1,ind_ori);
            yo = x_kk(2,ind_ori);

            xX = x_kk(1,ind_X);
            yX = x_kk(2,ind_X);

            xY = x_kk(1,ind_Y);
            yY = x_kk(2,ind_Y);

            xXY = x_kk(1,ind_XY);
            yXY = x_kk(2,ind_XY);

            uu = cross(cross([xo;yo;1],[xXY;yXY;1]),cross([xX;yX;1],[xY;yY;1]));
            xc = uu(1)/uu(3);
            yc = uu(2)/uu(3);

            bbb = cross(cross([xo;yo;1],[xY;yY;1]),cross([xX;yX;1],[xXY;yXY;1]));
            uu = cross(cross([xo;yo;1],[xX;yX;1]),cross([xc;yc;1],bbb));
            xXc = uu(1)/uu(3);
            yXc = uu(2)/uu(3);

            bbb = cross(cross([xo;yo;1],[xX;yX;1]),cross([xY;yY;1],[xXY;yXY;1]));
            uu = cross(cross([xo;yo;1],[xY;yY;1]),cross([xc;yc;1],bbb));
            xYc = uu(1)/uu(3);
            yYc = uu(2)/uu(3);

            uX = [xXc - xc;yXc - yc];
            uY = [xYc - xc;yYc - yc];
            uO = [xo - xc;yo - yc];

            uX = uX / norm(uX);
            uY = uY / norm(uY);
            uO = uO / norm(uO);

            delta = 30;

            % axes
            plot([xo;xX]+1,[yo;yX]+1,'g-','linewidth',2);
            plot([xo;xY]+1,[yo;yY]+1,'g-','linewidth',2);
            text(xXc + delta * uX(1) +1 ,yXc + delta * uX(2)+1,'X','color','g','Fontsize',14);
            text(xYc + delta * uY(1)+1 ,yYc + delta * uY(2)+1,'Y','color','g','Fontsize',14,'HorizontalAlignment','center');
            text(xo + delta * uO(1) +1,yo + delta * uO(2)+1,'Origin','color','g','Fontsize',14);

        end;


        title(['Image ' num2str(kk) ' - Image points (+) and reprojected grid points (o)']);
        cs = num2str(kk);
        eval(['xt = x_' cs ';']);
        plot(xt(1,:)+1,xt(2,:)+1,'r+','LineWidth',2);
        %eval(['plot(x_' num2str(kk) '(1,:)+1,x_' num2str(kk) '(2,:)+1,''r+'');']);
        ndx = rem(kk-1,6)+1;
        cstr = [colors(ndx) 'o'];
        eval(['yt = y_' cs ';']);

        plot(yt(1,:)+1,yt(2,:)+1,cstr);
        %eval(['plot(y_' num2str(kk) '(1,:)+1,y_' num2str(kk) '(2,:)+1,''' colors(rem(kk-1,6)+1) 'o'');']);
        eval(['expts = ex_' num2str(kk) ';']);
        quiver(yt(1,:)+1,yt(2,:)+1,expts(1,:),expts(2,:),colors(ndx));
        %eval(['quiver(y_' num2str(kk) '(1,:)+1,y_' num2str(kk) '(2,:)+1,ex_' num2str(kk) '(1,:),ex_' num2str(kk) '(2,:),1,''' colors(rem(kk-1,6)+1) ''');']);
        zoom on;
        %axis([1 nx 1 ny]);
        hold off;
        drawnow;


        set(5+kk,'color',[1 1 1]*0.25);
        set(5+kk,'Name',['Image ' num2str(kk)],'NumberTitle','off');


    end;

end;
Warning: Image is too big to fit on screen; displaying at 25%
Warning: Image is too big to fit on screen; displaying at 25%
Warning: Image is too big to fit on screen; displaying at 25%
Warning: Image is too big to fit on screen; displaying at 25%
if n_ima ~= 0 && exist('ex','var')
err_std = std(ex')';
fprintf('Pixel error:      err = [%3.5f   %3.5f] (all active images)\n\n',err_std);
end;
Pixel error: err = [3.60275 2.10215] (all active images)