Download aoi.zip
Reference: aoi1.m
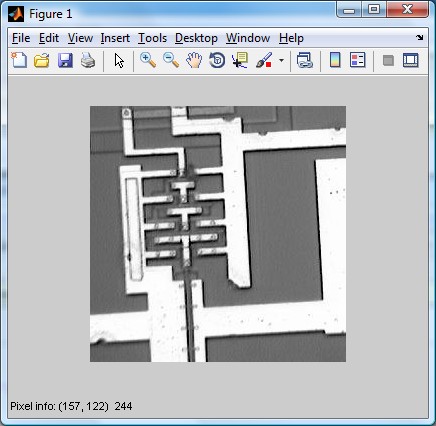
impixelinfo toggles an interactive display of information
about image pixels in the current figure. impixelinfo
installs a information bar at the bottom of the figure, which displays the
row-column coordinates for whatever pixel the cursor is currently
over, and the color information for that pixel. If the image is
binary or intensity, the color information is a single intensity
value. If the image is indexed or RGB, the color information is an
RGB triplet. The values displayed are the actual data values,
regardless of the class of the image array, or whether the data is in
normal image range.
ģ im = imread('ic.jpg');
ģ imshow(im);
ģ impixelinfo;
h = imdistline creates a Distance tool on the current axes.
The Distance tool is a draggable, resizable line, superimposed on an axes, that measures
the distance between the two endpoints of the line.
ģ im = imread('ic.jpg');
ģ imshow(im);
ģ hd = imdistline;
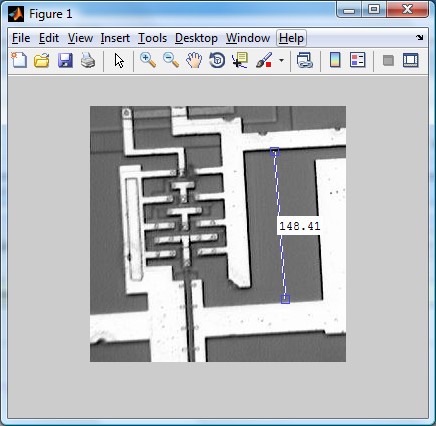
The Distance tool contains a structure of function handles, called an API, that can be used to retrieve distance information and control other aspects of Distance tool behavior.
code>api = iptgetapi(hd) returns the API structure
associated with handle hd if there is one.
w = api.getDistance(), for example, returns the
distance between the endpoints of the Distance tool. The value
returned is in data units determined by the XData and YData
properties, which is pixels, by default.
Reference: aoi2.m
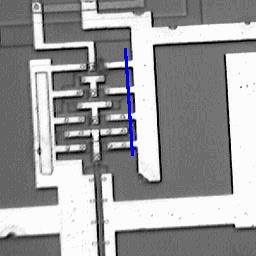
impixel returns the red, green, and blue color values
of specified image pixels.
impixel displays the input image and waits for you to
specify the pixels with the mouse.
Use normal button clicks to select pixels. Press Backspace or Delete to remove the previously selected pixel. A shift-click, right-click, or double-click adds a final pixel and ends the selection; pressing Return finishes the selection without adding a pixel.
ģ v = impixel(im) V = 255 255 255 113 113 113
Two points were chosen, as shown by the asterisks below, the first in a high level region and the second in a low level region.
![]()
Reference: aoi2.m
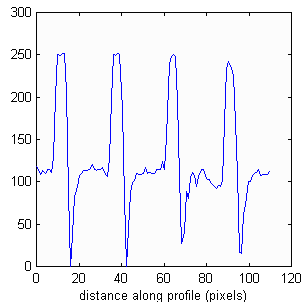
improfile computes the intensity values along a
line or a multiline path in an image. improfile selects
equally spaced points along the path you specify, and then uses
interpolation to find the intensity value for each point.
improfile works with grayscale intensity images and RGB
images.
You specify the line or path using the mouse, by clicking on
points in the image. Press Backspace or
Delete to remove the previously selected point. A
shift-click, right-click, or double-click adds a final point and ends
the selection; pressing Return finishes the
selection without adding a point. When you finish selecting points,
improfile returns the interpolated data values in
c. c is an n-by-1 vector if
the input is a grayscale intensity image, or an
n-by-1-by-3 array if the input is an RGB image.
If you omit the output argument, improfile displays a
plot of the computed intensity values.
ģ im = imread('ic.jpg');
ģ imshow(im);
ģ improfile
The blue line below shows the region profiled.
ģ [cx, cy, c] = improfile;
ģ cx = cx - cx(1);
ģ cy = cy - cy(1);
ģ cr = sqrt(cx.*cx+cy.*cy);
ģ plot(cr,c)
ģ xlabel('distance along profile (pixels)');
Reference: aoi2.m
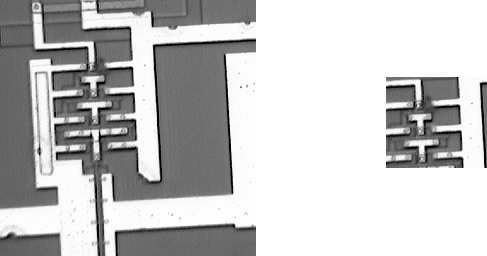
imcrop crops an image to a specified rectangle.
Press the left mouse button and drag
to define the crop rectangle. Finish by releasing the mouse button.
If you hold down the Shift key while dragging, or
if you press the right mouse button,
imcrop constrains the bounding rectangle to be a
square.
When you release the mouse button, imcrop returns the
cropped image in the supplied output argument. If you do not supply
an output argument, imcrop displays the output image in
a new figure.
ģ im2 = imcrop(im,[60 40 100 90]); ģ whos im2 Name Size Bytes Class im2 91x101 9191 uint8 array
Maintained by John Loomis, last updated 19 Jan 2011