bp1
finding differences in images
Contents
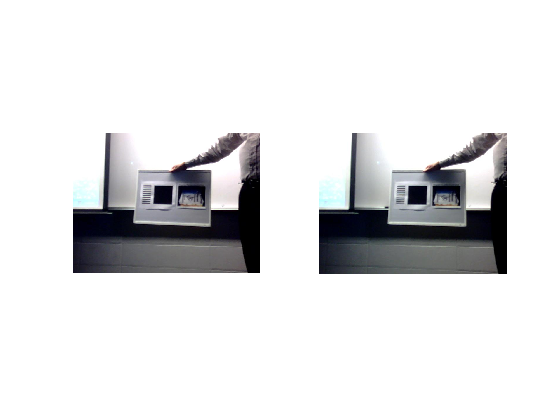
read images
% original images
clear
m1 = imread('seq1_im01.jpg');
m2 = imread('seq1_im02.jpg');
subplot(1,2,1);
imshow(m1);
subplot(1,2,2);
imshow(m2);
disp('image size');
disp(size(m1));
image size
   480   640     3
convert to grayscale and find differences
close all
g1 = im2double(rgb2gray(m1));
g2 = im2double(rgb2gray(m2));
d = g2 - g1;
dmax = max(max(d));
dmin = min(min(d));
fprintf('max diff  %g\nmin diff %g\n',dmax,dmin);
max diff  0.996078
min diff -0.992157
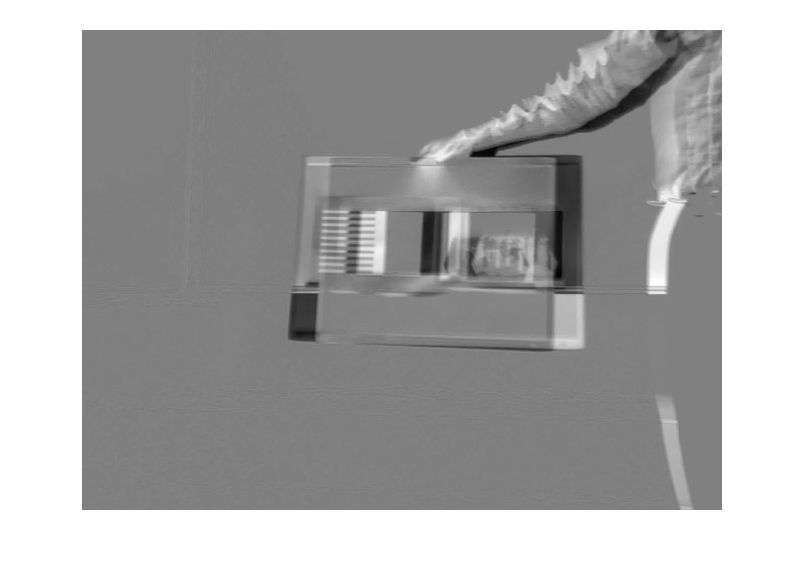
show differences
One way of illustrating differences is to map the image range -1 .. 1 into 0 .. 1 by (1+diff)/2
cdiff = (1+d)/2;
imshow(cdiff);
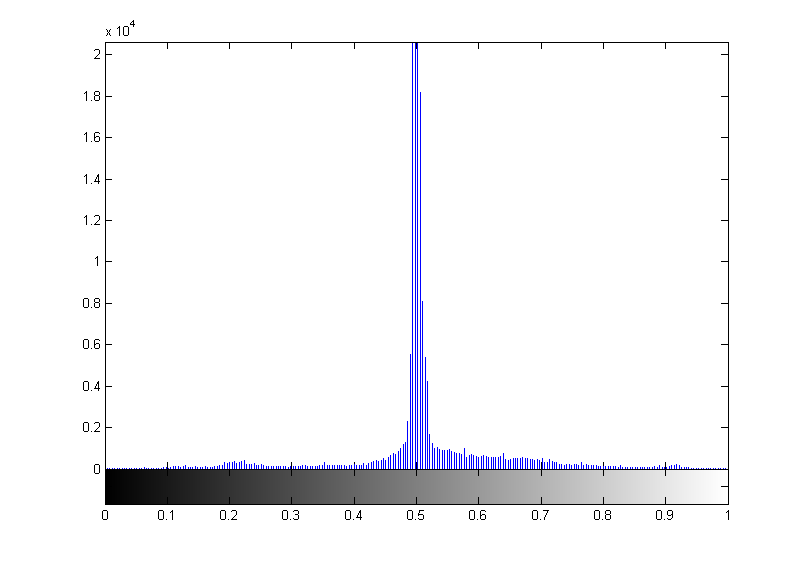
difference histogram
% zero difference corresponds to 0.5 brightness
imhist(cdiff)
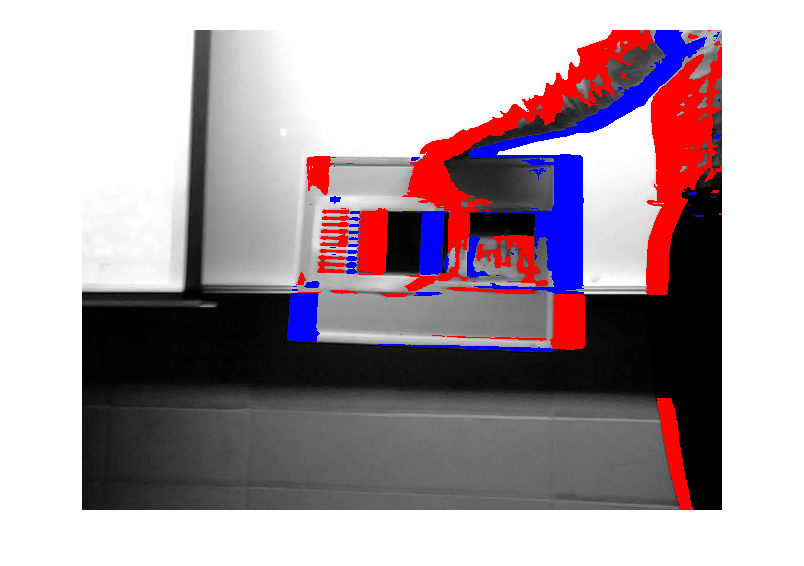
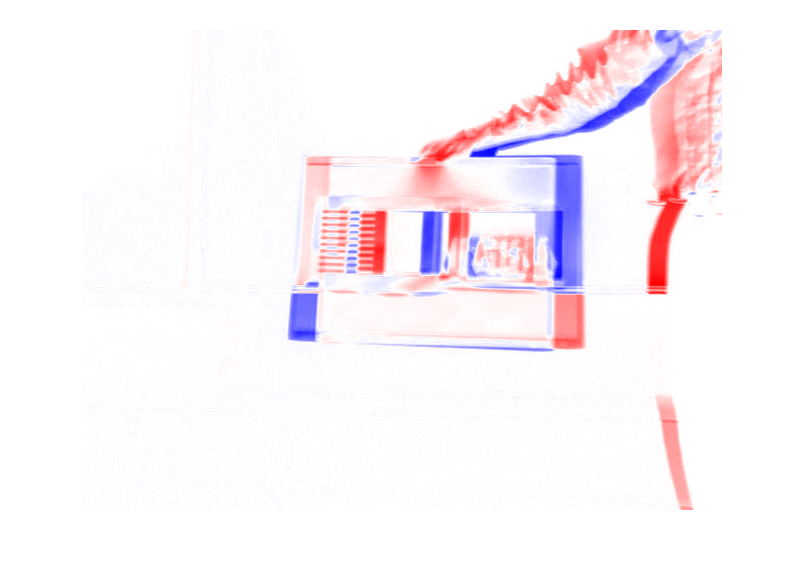
color difference display (on white)
red is positive difference, blue is negative difference
% white background
bipolar_image(d,2);
color difference display (on image)
% superimpose on image
thres = 0.15*max(dmax,-dmin);
k1 = d < -thres;
k2 = d >  thres;
g = (g1.*not(k1)).*not(k2);
final = cat(3,g+double(k2),g,g+double(k1));
imshow(final);