demo4
Contents
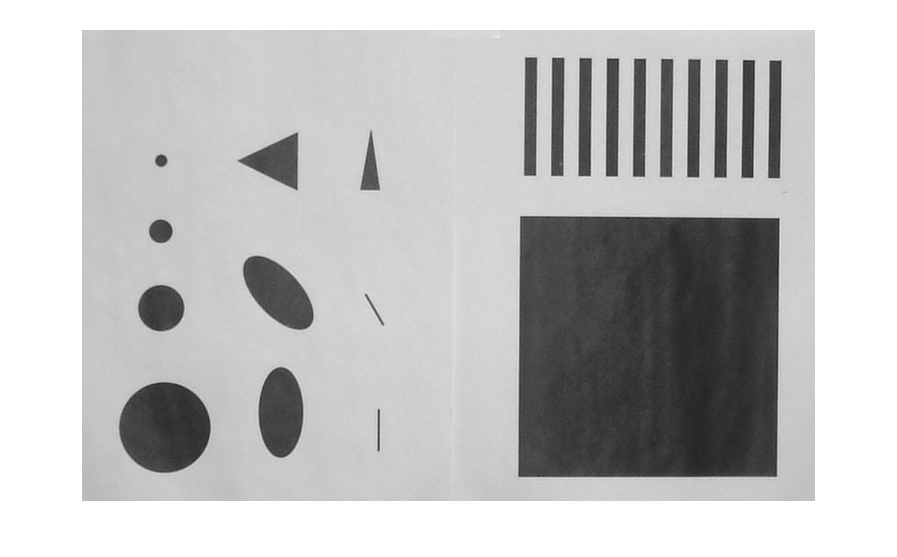
clear
close all
filename = '2013_0115_163116AA.JPG';
img = im2double(rgb2gray(imread(filename)));
% crop rect from basics.m
rect = [637.5  484.5  732  470];
g = imcrop(img,rect);
imshow(g);
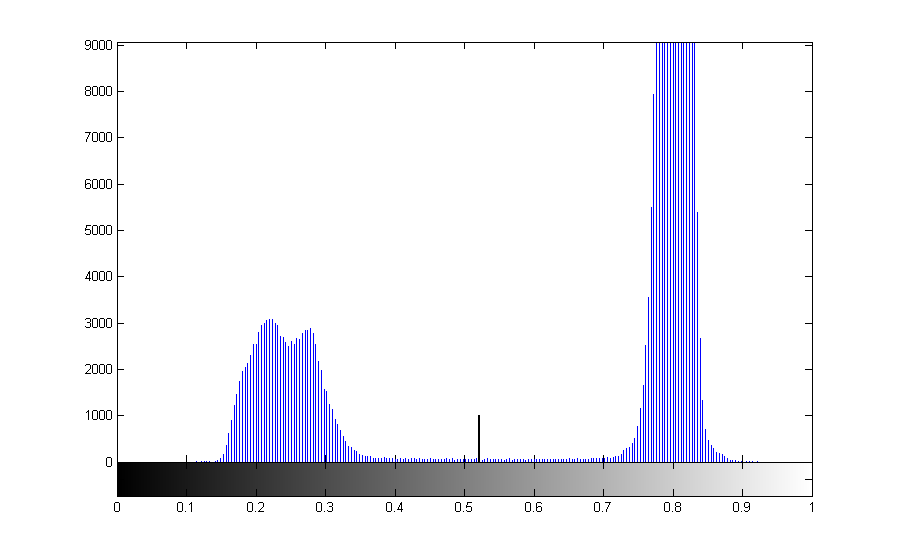
histogram, graythresh and im2bw
level = graythresh(I) computes a global threshold (level) that can be used to convert an intensity image to a binary image with im2bw. level is a normalized intensity value that lies in the range [0, 1].
%The graythresh function uses Otsu's method, which chooses the threshold
% to minimize the intraclass variance of the black and white pixels.

imhist(g);
level = graythresh(g);
hold on
plot([level level],[0 1000],'k-','Linewidth',2);
hold off
fprintf('threshold %g\n',level);
threshold 0.521569
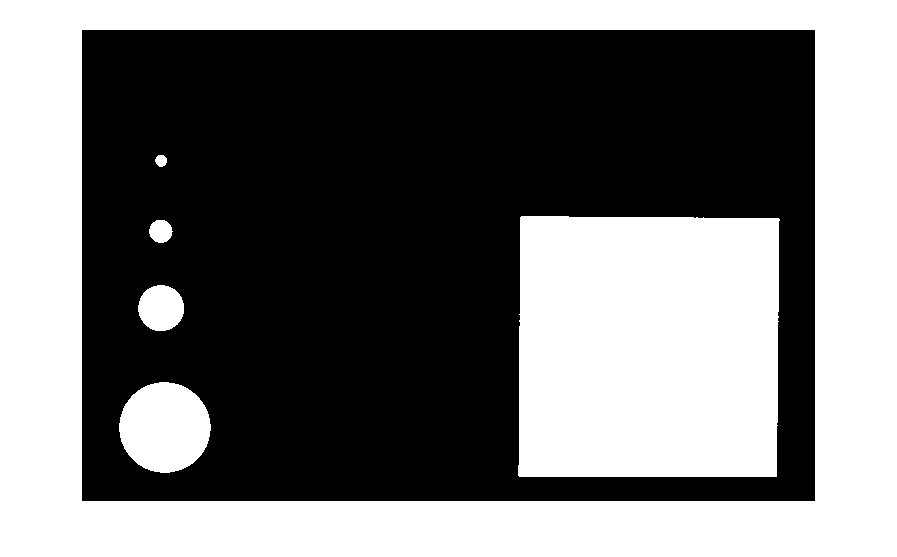
convert to bw image
BW = im2bw(g,level);
imshow(BW);
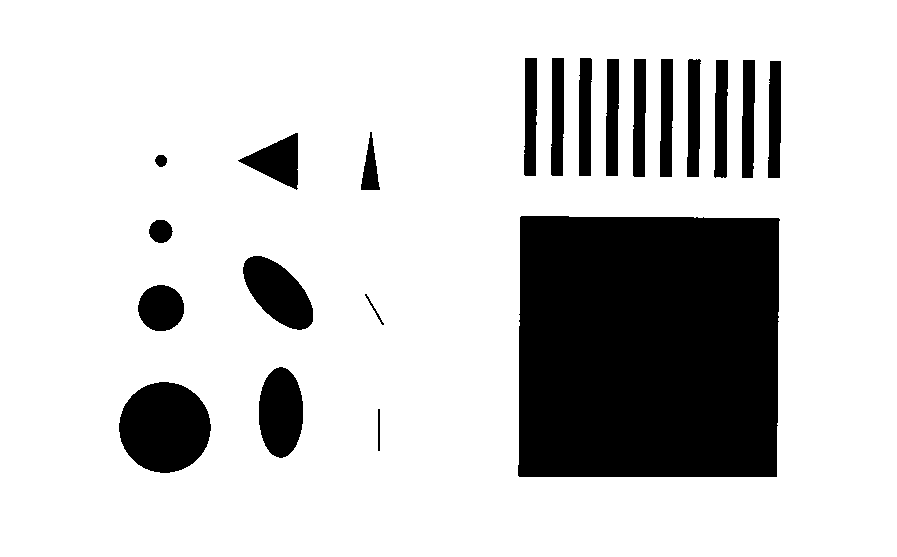
bwconncomp
CC = bwconncomp(BW) returns the connected components CC found in BW. The binary image BW can have any dimension. CC is a structure with four fields.
CC = bwconncomp(~BW);
disp(CC)
    Connectivity: 8
       ImageSize: [471 733]
      NumObjects: 21
    PixelIdxList: {1x21 cell}
regionprops
stats = regionprops(CC)
n = CC.NumObjects;
fprintf('      object        area\n');
area = [stats.Area];
disp( [ [1:n]' area']);
stats =

21x1 struct array with fields:

    Area
    Centroid
    BoundingBox

      object        area
           1        6499
           2        1667
           3         424
           4         112
           5        1768
           6        3196
           7        3158
           8         591
           9          69
          10          84
          11       67258
          12        1383
          13        1405
          14        1417
          15        1397
          16        1401
          17        1397
          18        1406
          19        1416
          20        1391
          21        1369
centroids
centers = cat(1,stats.Centroid)
centers =

   83.3664  398.0003
   79.6449  278.6233
   79.2712  201.8656
   79.6696  131.2946
  196.2104  131.6974
  196.7225  263.3773
  199.4427  383.0833
  288.9577  140.1523
  293.0870  280.2609
  297.5000  400.5000
  567.0909  317.5029
  449.1518   87.0788
  476.2007   87.2954
  503.6824   87.4869
  530.9485   88.0315
  558.0214   88.4354
  585.1160   88.3207
  612.3122   88.3890
  639.7507   89.4887
  666.8749   89.1380
  693.3448   90.3638
labelmatrix
L = labelmatrix(CC) creates a label matrix from the connected components structure CC returned by bwconncomp. The size of L is CC.ImageSize. The elements of L are integer values greater than or equal to 0.
L = labelmatrix(CC);
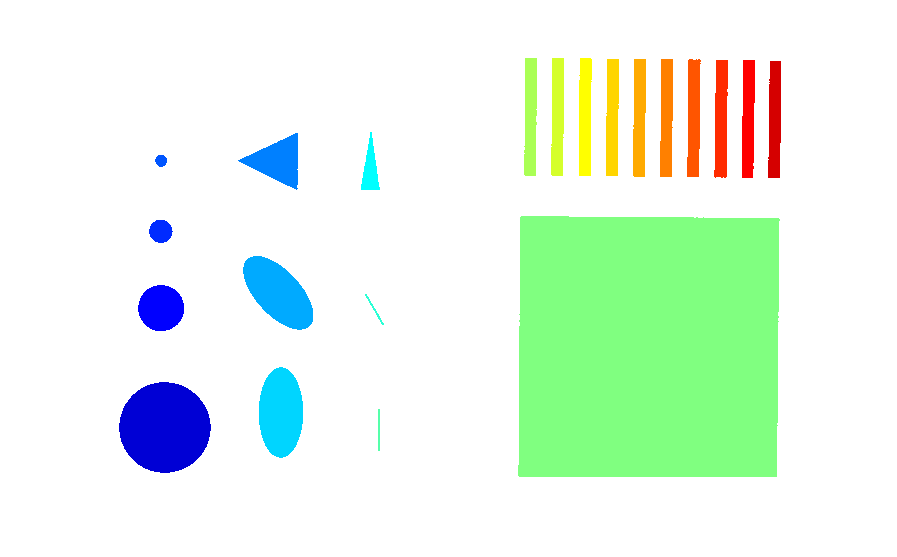
label2rgb
RGB = label2rgb(L) converts a label matrix into an RGB color image for the purpose of visualizing the labeled regions.
RGB = label2rgb(L);
imshow(RGB);
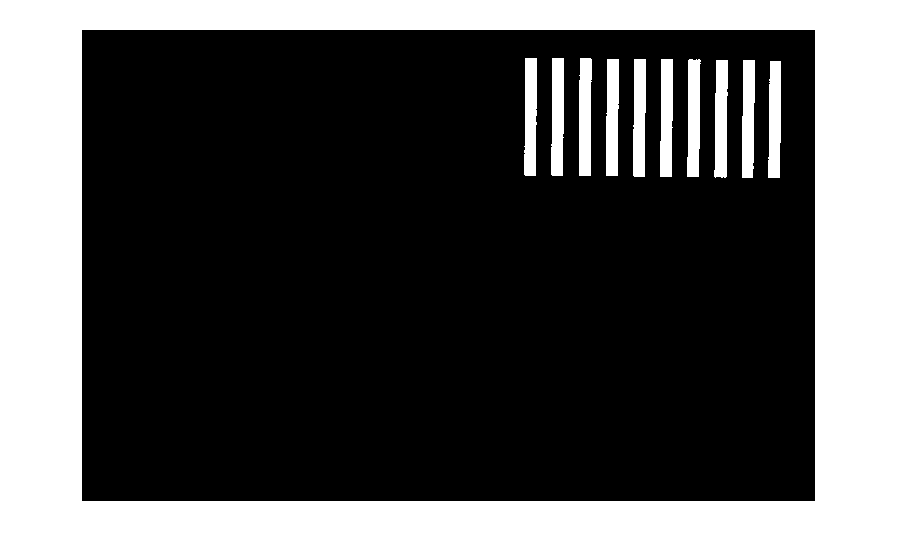
select certain objects
idx = find(abs([stats.Area]-1400)<35);
BW2 = ismember(L,idx);
imshow(BW2);
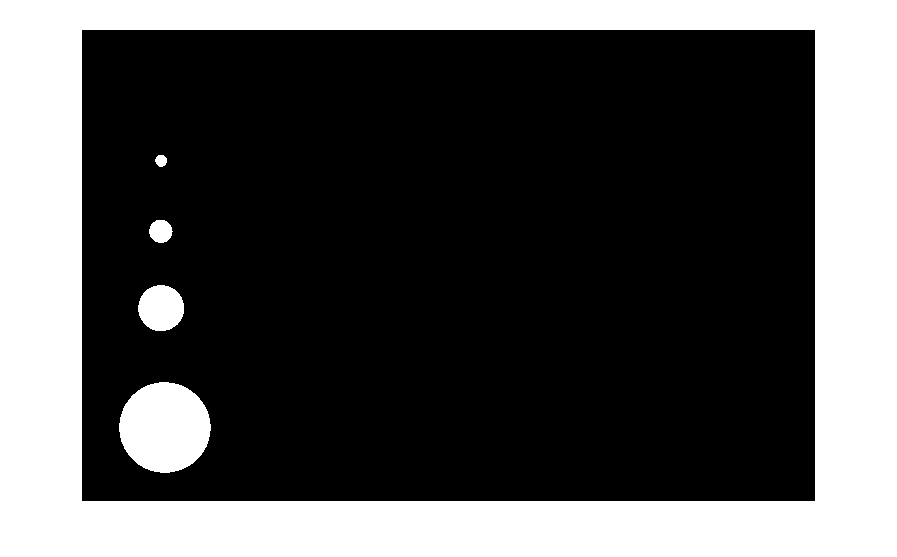
select first four objects
imshow(ismember(L,1:4));
select based on eccentricity
s = regionprops(CC,'Eccentricity');
idx = find([s.Eccentricity]<0.3);
imshow(ismember(L,idx));