Color Components
See example of script output: Mandrill.
Contents
title = 'Mandrill';
base = 'Mandrill';
filename = [base '.jpg'];
rgb = im2double(imread(filename));


% open output html file
fp = fopen([base '.html'],'wt');
str = [title ' Color Components'];
fprintf(fp,'<html>\n<head>\n<title>%s</title>\n</head>\n<body>\n<h1>%s</h1>\n',str,str);
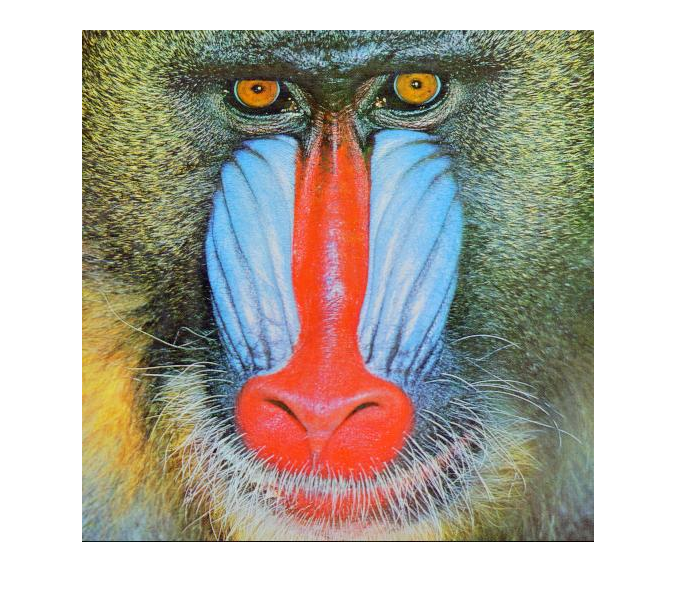
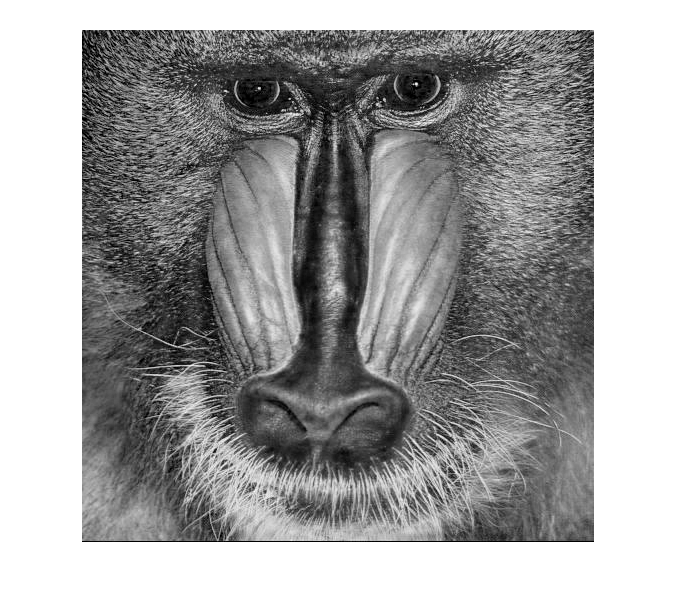
Original Image
sz = size(rgb);
fprintf(fp,'<h3>Original Image</h3>\n\n<p><table border>\n');

maxdim = max(sz(1:2));
if (maxdim>512)
    scl = 512/maxdim;
    fprintf('image size reduced by %g\n',scl);
    rgbs = imresize(rgb,scl);
    sfile = [base '_sm.jpg'];
    imwrite(rgbs,sfile);
    fprintf(fp,'<tr><td><a href="%s"><img src="%s"></a></tr>',filename,sfile);
else
    rgbs = rgb;
    sfile = filename;
    fprintf(fp,'<tr><td><img src="%s"></tr>',sfile);
end
imshow(rgbs);
fprintf(fp,'<tr align="center"><td>%s</tr>',[ 'Original ' title ' image']);
fprintf(fp,'</table>');
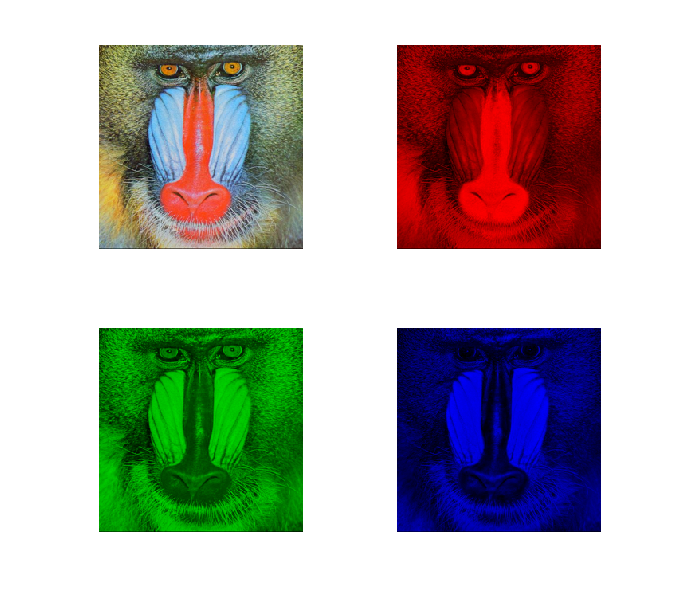
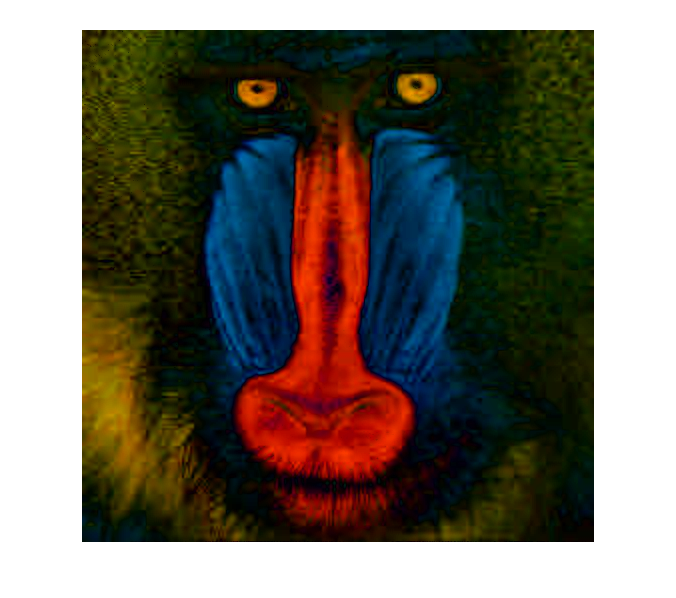
RGB Components
rgbmax = squeeze(max(max(rgb)));

r = rgbs(:,:,1);
g = rgbs(:,:,2);
b = rgbs(:,:,3);
rgbs2 = imresize(rgbs,0.5);
rs = imresize(r,0.5);
gs = imresize(g,0.5);
bs = imresize(b,0.5);
z = zeros(size(rs));
rs = cat(3,rs,z,z);
gs = cat(3,z,gs,z);
bs = cat(3,z,z,bs);
f1 = [base '_sm_rgb.jpg'];
f2 = [base '_sm_r.jpg'];
f3 = [base '_sm_g.jpg'];
f4 = [base '_sm_b.jpg'];


imwrite(rgbs2,f1);
imwrite(rs,f2);
imwrite(gs,f3);
imwrite(bs,f4);

subplot(2,2,1);
imshow(rgbs2);
subplot(2,2,2);
imshow(rs);
subplot(2,2,3);
imshow(gs);
subplot(2,2,4);
imshow(bs);

fprintf(fp,'<h3>RGB Components</h3>\n\n<p><table border>\n');
fprintf(fp,'<tr><td><img src="%s"><td><img src="%s"></tr>\n',f1,f2);
fprintf(fp,'<tr><td><img src="%s"><td><img src="%s"></tr>\n',f3,f4);
fprintf(fp,'</table>\n\n');

clear rgbs2 rs gs bs f1 f2 f3 f4;
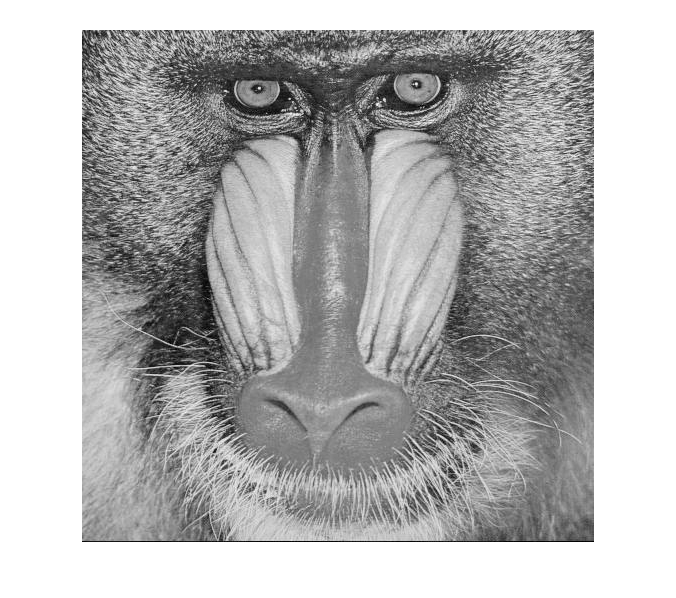
NTSC Y Channel
subplot(1,1,1);
gray = 0.3*r+0.59*g+0.11*b;
scl= 1/max(max(gray));
gray = gray*scl;
gfile = [base '_y.jpg'];
imwrite(gray,gfile);

fprintf(fp,'<h3>NTSC Y channel</h3>\n\n<p><table border>\n');
fprintf(fp,'<tr><td><img src="%s"></tr>\n',gfile);
fprintf(fp,'<tr align="center"><td>0.3*r+0.59*g+0.11*b</tr>\n</table>\n');
if scl>1
    fprintf(fp,'<p>gray levels scaled by %g\n\n',scl);
    fprintf('gray levels scaled by %g\n',scl);
end
imshow(gray);
gray levels scaled by 1.06981
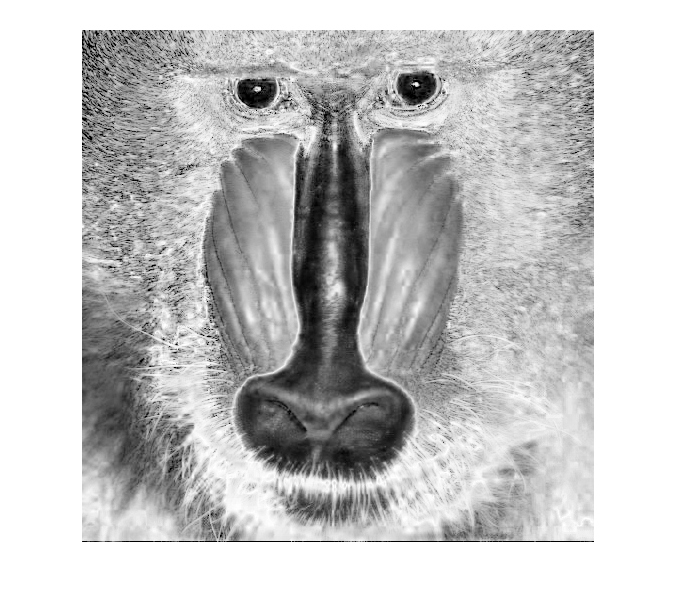
Inverse Saturation Image
sz = size(rgbs);
w = reshape(rgbs,sz(1)*sz(2),3);
u = min(w,[],2);
v = max(w,[],2);
sat = reshape(u./v,sz(1),sz(2));
imshow(sat);

fs = [base '_sat.jpg'];
imwrite(sat,fs);
fprintf(fp,'<h3>1-S</h3>\n\n<p>inverse saturation image\n\n');
fprintf(fp,'<p><table border>\n<tr><td><img src="%s"></tr>\n',fs);
fprintf(fp,'<tr align="center"><td>min(r,g,b)/max(r,g,b)</tr>\n');
fprintf(fp,'</table>');
clear sat fs;
White Component
scl = 1/max(u);
minv = reshape(u*scl,sz(1),sz(2));
white = reshape(u*scl,sz(1),sz(2));
imshow(white);

fs = [base '_white.jpg'];
imwrite(white,fs);
fprintf(fp,'<h3>White Component</h3>\n\n');
fprintf(fp,'<p><table border>\n<tr><td><img src="%s"></tr>\n',fs);
fprintf(fp,'<tr align="center"><td>min(r,g,b)</tr>\n');
fprintf(fp,'</table>');
if scl>1
    fprintf(fp,'<p>gray levels scaled by %g\n\n',scl);
    fprintf('gray levels scaled by %g\n',scl);
end
clear white fs
gray levels scaled by 1.11842
Color Component
color = w - [u u u];
scl = 1/max(max(color));
color = reshape(color*scl,sz(1),sz(2),3);
imshow(color);

fs = [base '_color.jpg'];
imwrite(color,fs)
fprintf(fp,'<h3>Color Component</h3>\n\n');
fprintf(fp,'<p><table border>\n<tr><td><img src="%s"></tr>\n',fs);
fprintf(fp,'<tr align="center"><td>(r,g,b) - min(r,g,b)</tr>\n');
fprintf(fp,'</table>');

if scl>1
    fprintf(fp,'<p>colors scaled by %g\n',scl);
    fprintf('colors scaled by %g\n',scl);
end
colors scaled by 1.04082
fprintf(fp,'<p><hr>\n\n');
fprintf(fp,'<p>generated by MATLAB script on <i>%s</i>\n',date);
fprintf(fp,'\n</body>\n</html>\n');
fclose(fp);