cohist session 1
Contents
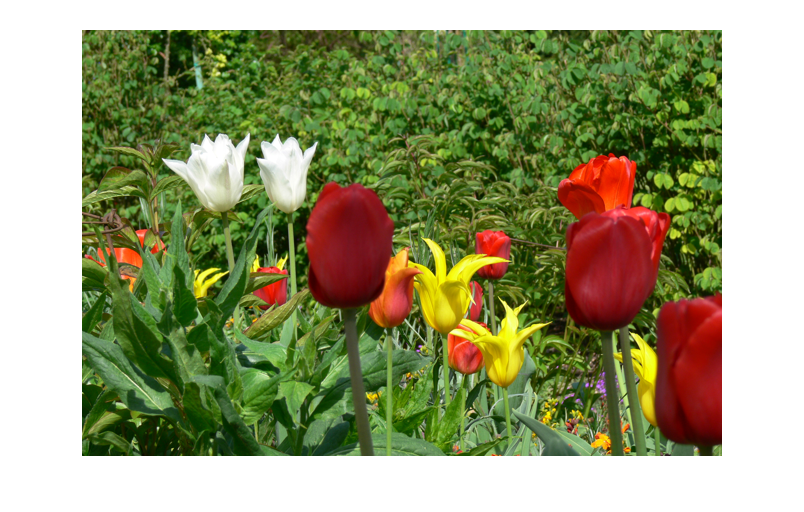
Original Image
filename = 'flowers4.png';
% filename = 'color_cube.jpg';
rgb = imread(filename);
rgb = im2double(rgb);
imshow(rgb);
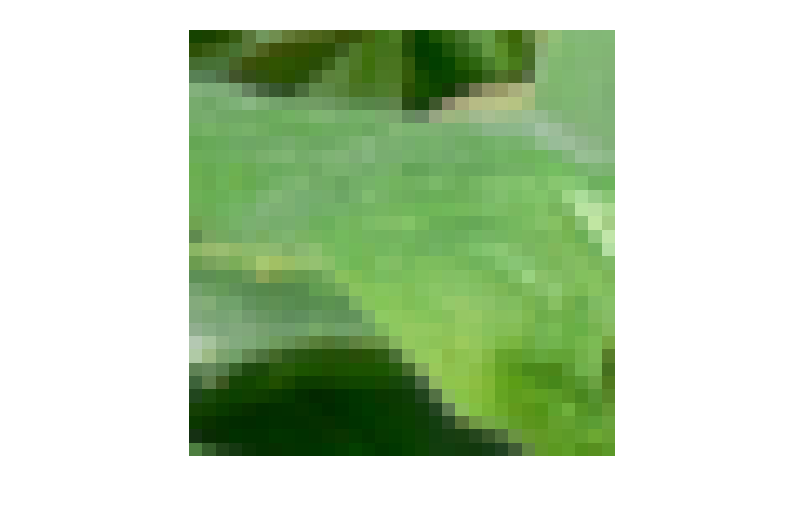
Choose background region
uncomment for interactive specification
imshow(rgb);
% [c r p] = impixel
% save sess1 c r p
load sess1
rect = [c(1)-15,r(1)-15,31,31];
hold on
plot(c(1),r(1),'yo');
text(c(1)+20,r(1),'sample');
hold off

mean background rgb
xc = rgb(:,:,1) - 0.5*(rgb(:,:,2)+rgb(:,:,3));
yc = sqrt(3)/2*(rgb(:,:,2)-rgb(:,:,3));
cohist((xc+1)/2,(yc+1)/2,32,4);samp = imcrop(rgb,rect);
imshow(samp);
sz = size(samp);
mcolor = sum(sum(samp))/(sz(1)*sz(2));
mcolor = mcolor(:);
fprintf('rgb means:  %g %g %g\n',mcolor);
rgb means: 0.38768 0.586432 0.293126
color distance from background
dev = sqrt((rgb(:,:,1)-mcolor(1)).^2+(rgb(:,:,2)-mcolor(2)).^2+(rgb(:,:,3)-mcolor(3)).^2);
imshow(dev);
imhist(dev);
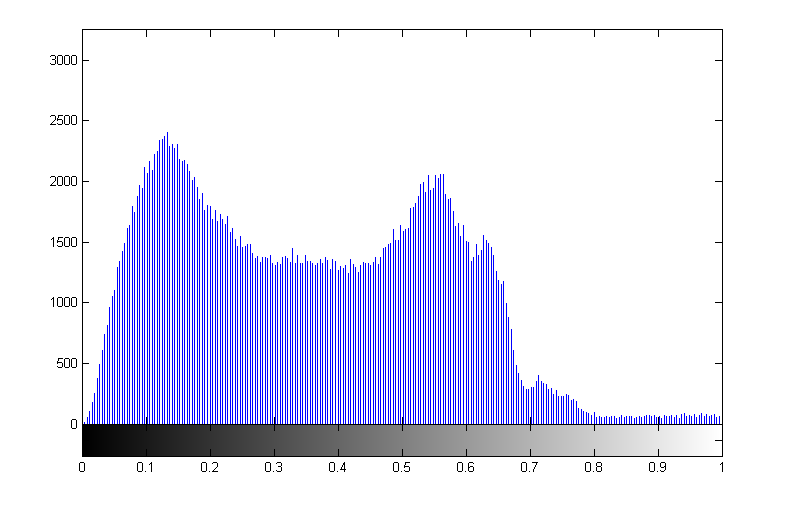
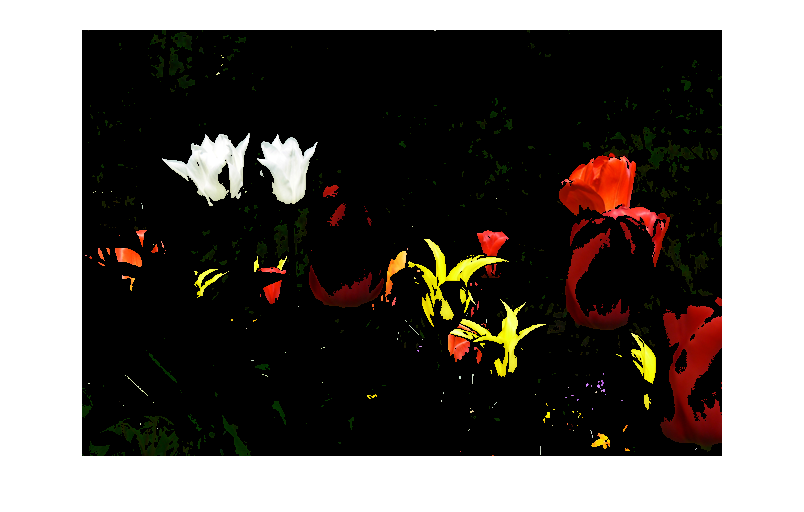
BW = im2bw(dev,0.6);
% imshow(BW);
imshow(cat(3,rgb(:,:,1).*BW,rgb(:,:,2).*BW,rgb(:,:,3).*BW));
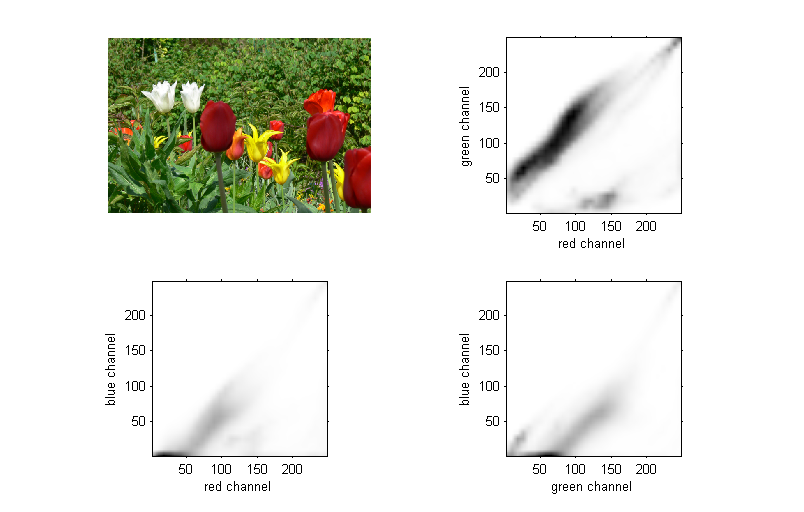
rgb co-histograms
subplot(2,2,1);
imshow(rgb);
subplot(2,2,2);
cohist(rgb(:,:,1),rgb(:,:,2));
xlabel('red channel');
ylabel('green channel');
subplot(2,2,3);
cohist(rgb(:,:,1),rgb(:,:,3));
xlabel('red channel');
ylabel('blue channel');
subplot(2,2,4);
cohist(rgb(:,:,2),rgb(:,:,3));
xlabel('green channel');
ylabel('blue channel');
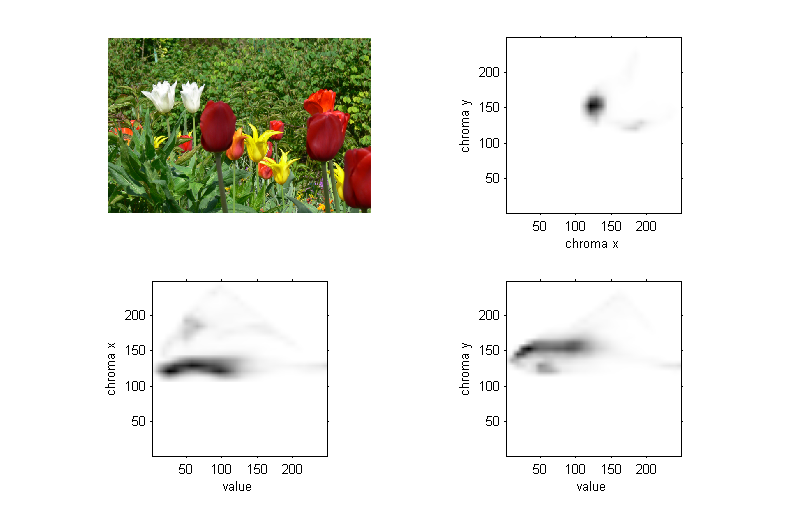
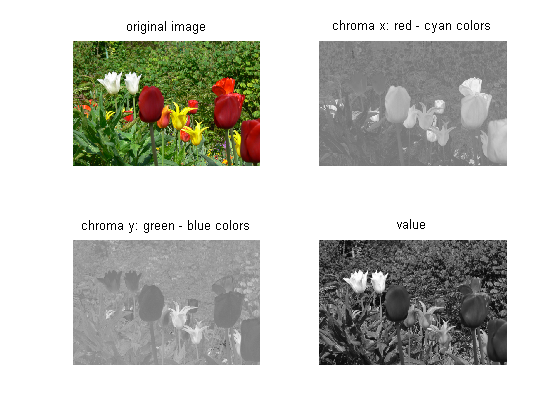
xyv co-histograms
xc = rgb(:,:,1) - 0.5*(rgb(:,:,2)+rgb(:,:,3));
yc = sqrt(3)/2*(rgb(:,:,2)-rgb(:,:,3));
zc = (rgb(:,:,1)+rgb(:,:,2)+rgb(:,:,3))/3;

subplot(2,2,1);
imshow(rgb);
subplot(2,2,2);
cohist((xc+1)/2,(yc+1)/2);
xlabel('chroma x');
ylabel('chroma y');
subplot(2,2,3);
cohist(zc,(xc+1)/2);
xlabel('value');
ylabel('chroma x');
subplot(2,2,4);
cohist(zc,(yc+1)/2);
xlabel('value');
ylabel('chroma y');
close
subplot(2,2,1);
imshow(rgb);
title('original image');

subplot(2,2,2);
imshow((xc+1)/2);
title('chroma x: red - cyan colors');

subplot(2,2,3);
imshow((yc+1)/2);
title('chroma y: green - blue colors');

subplot(2,2,4);
imshow(zc);
title('value');
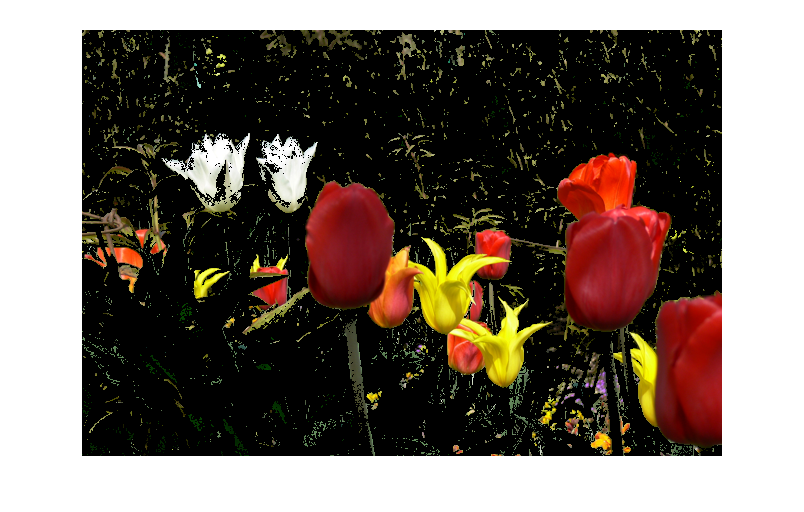
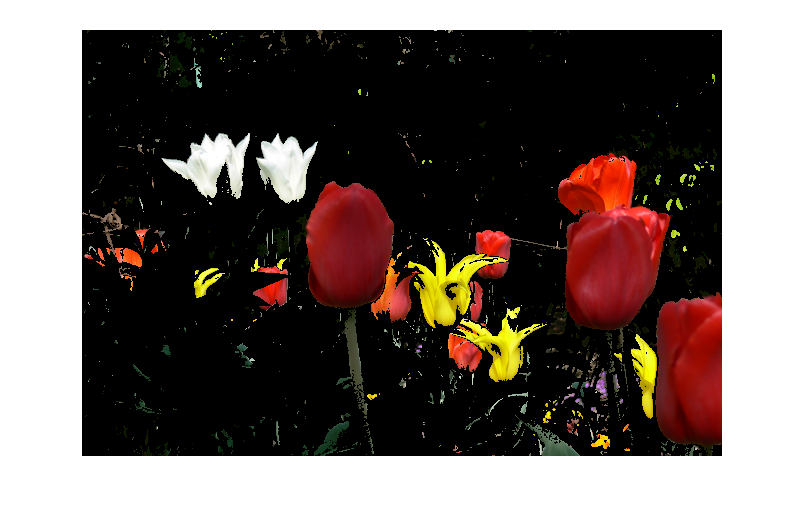
ad-hoc chroma selection
close
bw4 = and(xc>-0.4,xc<0.6);
bw5 = and(yc>0.1,yc<0.5);
bw6 = ~(bw4&bw5);
%imshow(bw5&bw4);
subplot(1,1,1);
imshow(cat(3,rgb(:,:,1).*bw6,rgb(:,:,2).*bw6,rgb(:,:,3).*bw6));
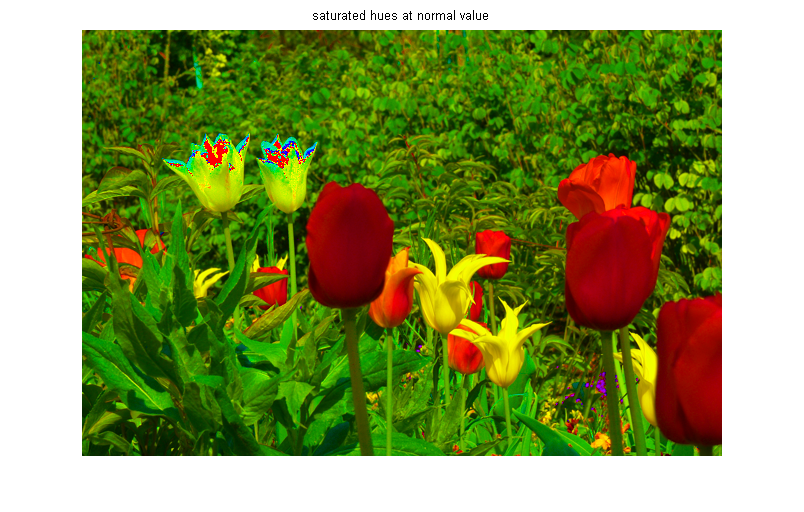
show saturated hues at normal value
hsv = rgb2hsv(rgb);
t1 = hsv(:,:,1);
t2 = ones(size(t1));
t3 = hsv(:,:,3);
rgb2 = hsv2rgb(cat(3,t1,t2,t3));
imshow(rgb2);
title('saturated hues at normal value');
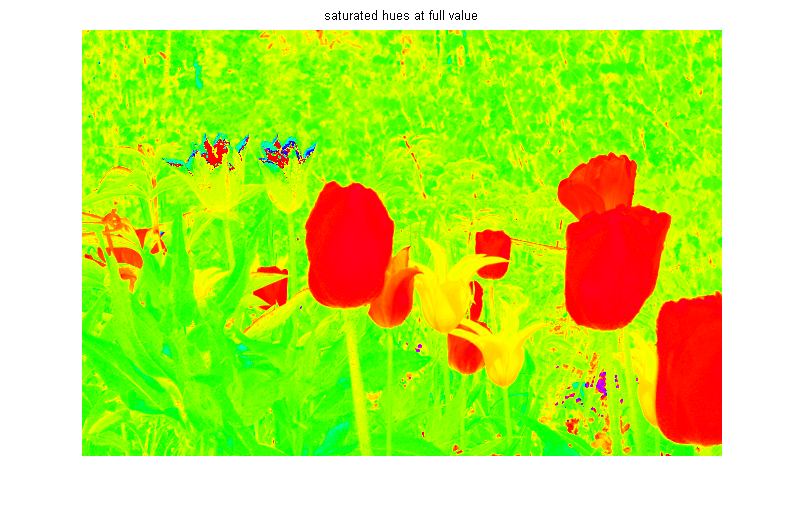
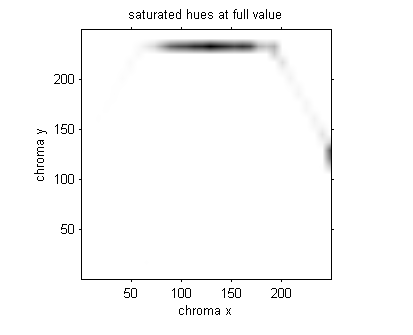
show saturated hues at full value
rgb3 = hsv2rgb(cat(3,t1,t2,t2));
imshow(rgb3);
title('saturated hues at full value');
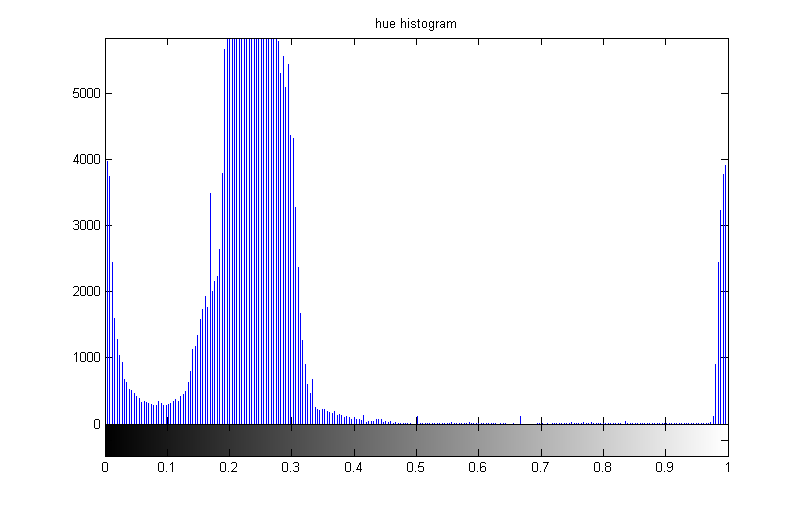
hue histogram
imhist(t1);
title('hue histogram');
xc = rgb3(:,:,1) - 0.5*(rgb3(:,:,2)+rgb3(:,:,3));
yc = sqrt(3)/2*(rgb3(:,:,2)-rgb3(:,:,3));
cohist((xc+1)/2,(yc+1)/2);
title('saturated hues at full value');
xlabel('chroma x');
ylabel('chroma y');
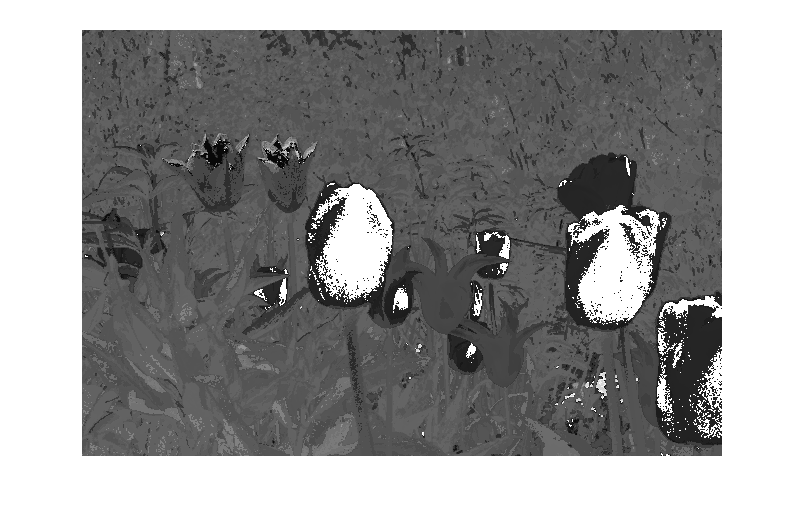
trun1 = round(8*hsv(:,:,1))/8;
trun2 = round(4*hsv(:,:,2))/4;
trun3 = round(8*hsv(:,:,3))/8;
rgb4 = hsv2rgb(cat(3,trun1,trun2,trun3));
imshow(rgb4);

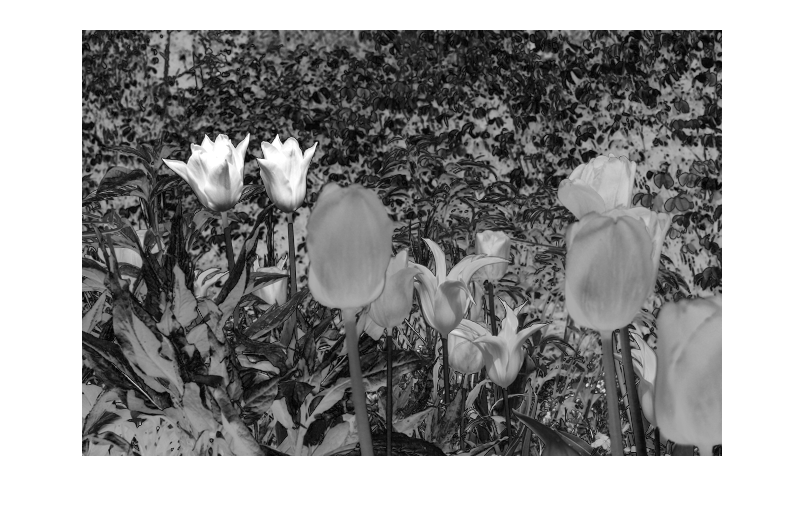
g = (trun3*8+trun2*32+trun1*256)/256;
imshow(g);
imhist(g);
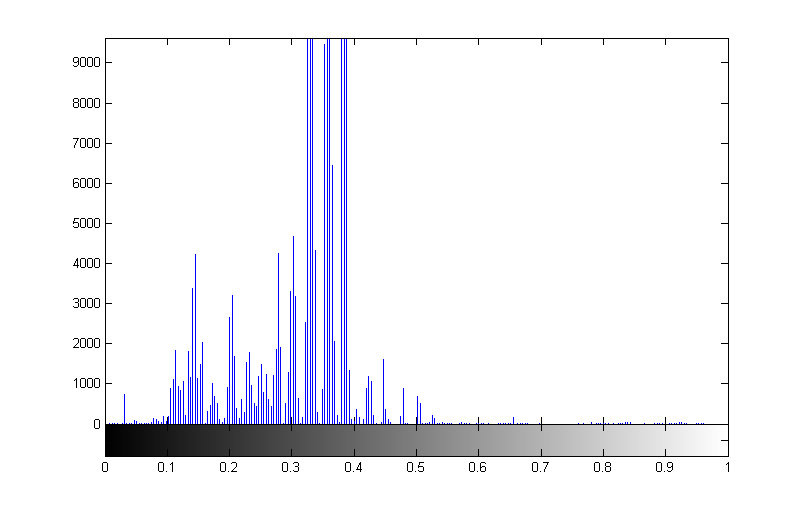
bw1 = ~and(g<0.5,g>0.3);
imshow(bw1);
imshow(cat(3,rgb(:,:,1).*bw1,rgb(:,:,2).*bw1,rgb(:,:,3).*bw1));