sess2
Contents
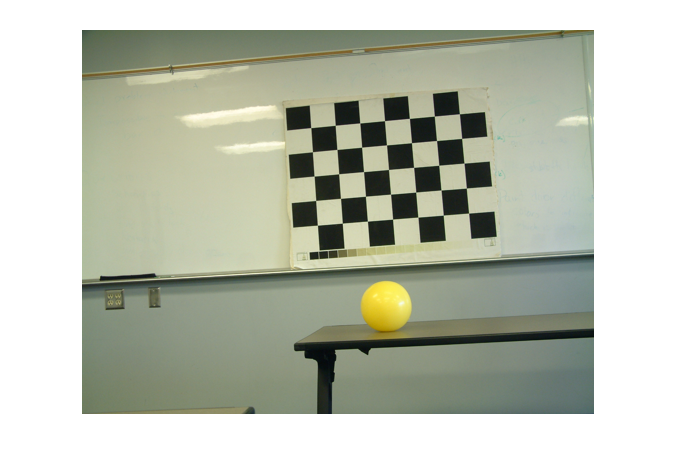
get filelist and first image
clear
load filelist
m = 5;
filename = char(files{m});
rgb1 = im2double(imread(filename));
g1 = rgb2gray(rgb1);
imshow(imresize(rgb1,0.25));
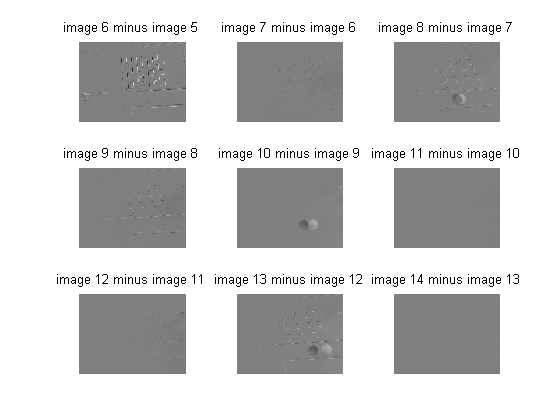
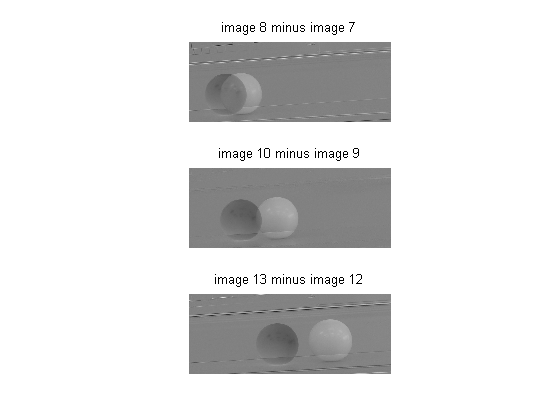
differences
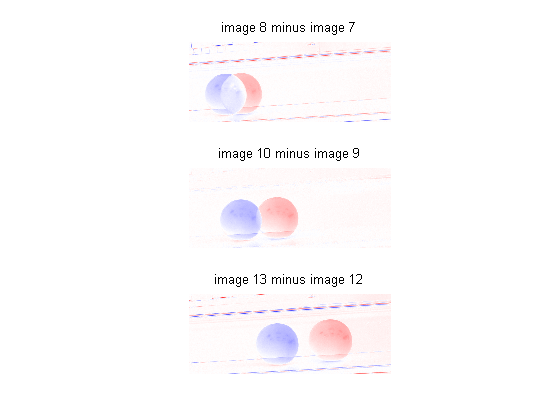
At some time, the checkerboard fell down and was repositioned. This could account for the differences in image 6 vs image 5. The ball moves between image 7 and image 8, between 9 and 10, and between 12 and 13.
close all
for m=5:13
    subplot(3,3,m-4)
    file1 = char(files{m});
    file2 = char(files{m+1});
    g1 = rgb2gray(im2double(imread(file1)));
    g2 = rgb2gray(im2double(imread(file2)));
    d = imresize(g2 - g1,0.25);
    imshow((d+1)/2);
    title(sprintf('image %d minus image %d',m+1,m));
end
crop region
close all
m = 9;
filename = char(files{m});
rgb9 = im2double(imread(filename));

% imshow(rgb9);
% [samp rect] = imcrop;
% save sess2 rect

load sess2
samp = imcrop(rgb9,rect);
imshow(samp);
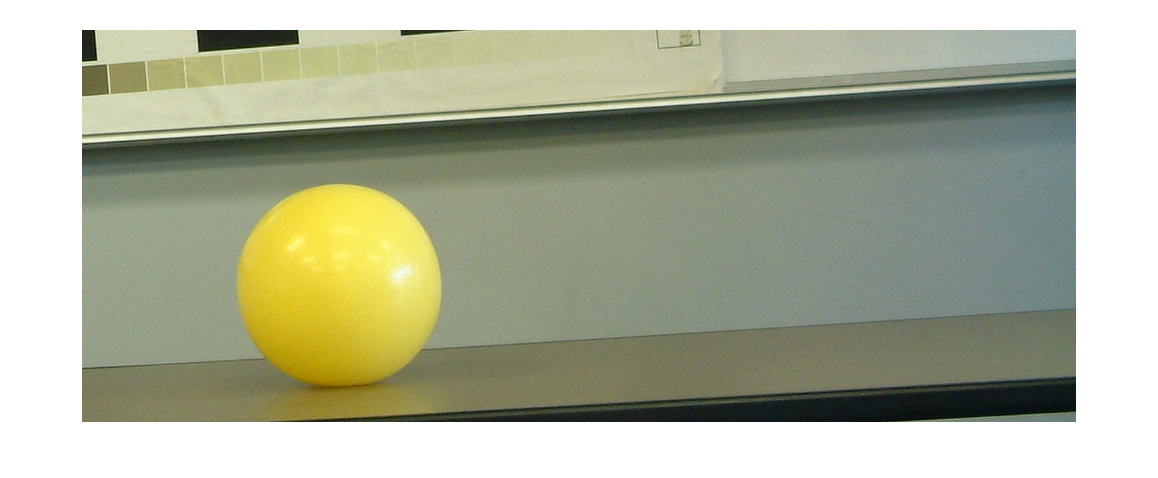
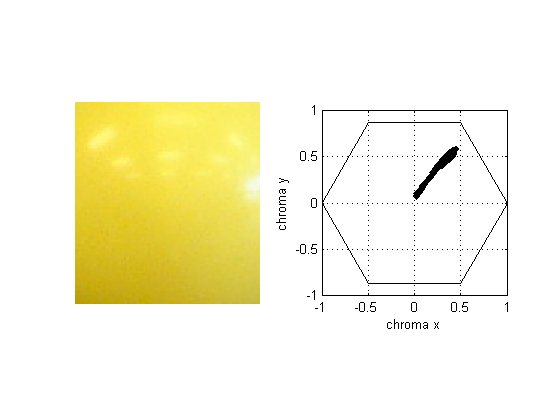
analyze ball color
% imshow(samp);
% [cp rect2] = imcrop;
% save sess2 rect rect2

close
rgb = imcrop(samp,rect2);
subplot(1,2,1);
imshow(rgb);
subplot(1,2,2);
v = sqrt(3)/2;
x = rgb(:,:,1) - 0.5*(rgb(:,:,2)+rgb(:,:,3));
y = v*(rgb(:,:,2)-rgb(:,:,3));
plot(x(:),y(:),'k.');
hold on
plot([1 0.5 -0.5 -1 -0.5 0.5 1],[0 v v 0 -v -v 0],'k');
hold off
axis([-1 1 -1 1]);
axis square
grid
xlabel('chroma x');
ylabel('chroma y');
motion (style 1)
close all
ms = [7 9 12];
for n = 1:3
    m = ms(n);
    subplot(3,1,n);
    file1 = char(files{m});
    file2 = char(files{m+1});
    g1 = rgb2gray(im2double(imread(file1)));
    gs1 = imcrop(g1,rect);
    g2 = rgb2gray(im2double(imread(file2)));
    gs2 = imcrop(g2,rect);
    d = gs2 - gs1;
    %imshow((d+1)/2);
    bipolar_image(d,0);
    title(sprintf('image %d minus image %d',m+1,m));
end
motion (style 2)
close all
ms = [7 9 12];
for n = 1:3
    m = ms(n);
    subplot(3,1,n);
    file1 = char(files{m});
    file2 = char(files{m+1});
    g1 = rgb2gray(im2double(imread(file1)));
    gs1 = imcrop(g1,rect);
    g2 = rgb2gray(im2double(imread(file2)));
    gs2 = imcrop(g2,rect);
    d = gs2 - gs1;
    bipolar_image(d);
    title(sprintf('image %d minus image %d',m+1,m));
end