foldbox
function foldbox
clf
set(gcf,'DoubleBuffer','on');
set(gcf,'Renderer','zbuffer');
set(gca,'xlim',[0 4], 'ylim',[0 4], 'zlim', [0 3]);
view(3); axis equal; grid on
t(1) = hgtransform;
t(2) = hgtransform('parent',t(1));
t(3) = hgtransform('parent',t(2));
t(4) = hgtransform('parent',t(3));
t(5) = hgtransform('parent',t(4));
t(6) = hgtransform('parent',t(5));
X = [0 0 1 1];
Y = [0 1 1 0];
Z = [0 0 0 0];
Xtext = .5;
Ytext = .5;
Ztext = .15;
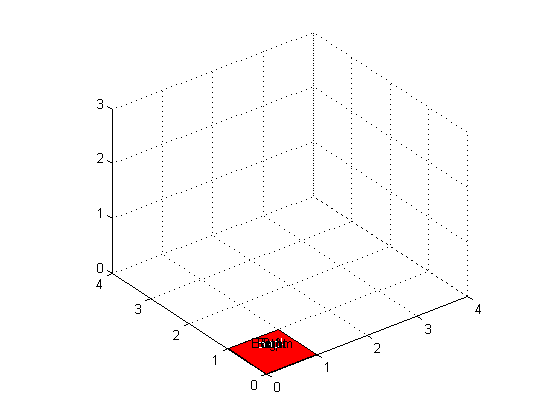
p(1) = patch('FaceColor','red','Parent',t(1));
txt(1) = text('String','Bottom','Parent',t(1));
p(2) = patch('FaceColor','green','Parent',t(2));
txt(2) = text('String','Right','Parent',t(2));
p(3) = patch('FaceColor','blue','Parent',t(3));
txt(3) = text('String','Back','Color','white','Parent',t(3));
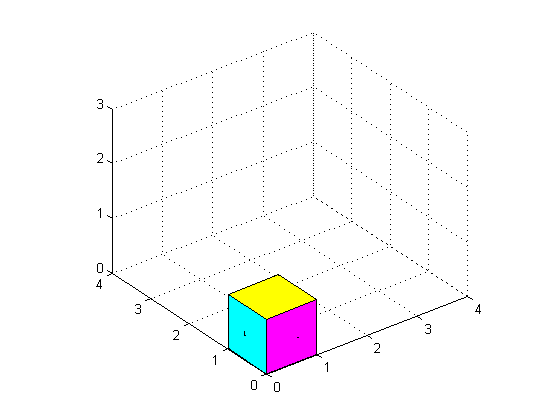
p(4) = patch('FaceColor','yellow','Parent',t(4));
txt(4) = text('String','Top','Parent',t(4));
p(5) = patch('FaceColor','cyan','Parent',t(5));
txt(5) = text('String','Left','Parent',t(5));
p(6) = patch('FaceColor','magenta','Parent',t(6));
txt(6) = text('String','Front','Parent',t(6));
set(p,'XData',X,'YData',Y,'ZData',Z)
set(txt,'Position',[Xtext Ytext Ztext],...
'HorizontalAlignment','center',...
'VerticalAlignment','middle')
showit(1)
Tx = makehgtform('translate',[1 0 0]);
Ty = makehgtform('translate',[0 1 0]);
set(t(2),'Matrix',Tx);
showit(1)
set(t(3),'Matrix',Ty);
showit(1)
set(t(4),'Matrix',Tx);
showit(1)
set(t(5),'Matrix',Ty);
showit(1)
set(t(6),'Matrix',Tx);
showit(1)
fold = pi/2;
Ry = makehgtform('yrotate',-fold);
RyTx = Tx*Ry;
Rx = makehgtform('xrotate',fold);
RxTy = Ty*Rx;
set(t(6),'Matrix',RyTx);
showit(1)
set(t(5),'Matrix',RxTy);
showit(1)
set(t(4),'Matrix',RyTx);
showit(1)
set(t(3),'Matrix',RxTy);
showit(1)
set(t(2),'Matrix',RyTx);
showit(1)
function showit(delay)
drawnow
pause(delay)