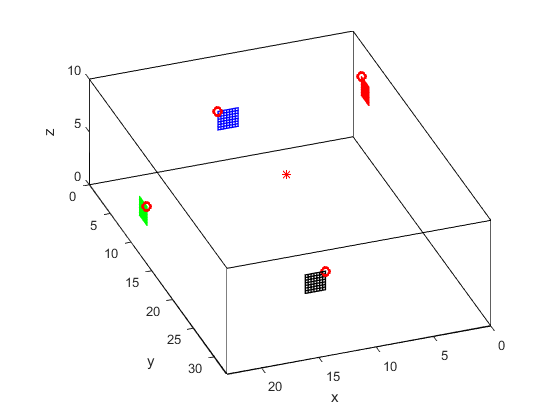
show room
close all
clear
load calib_data
dX = 3;
dY = 3;
nx = 4608;
ny = 2592;
vcube = [ 0 0 0; 1 0 0; 1 1 0; 0 1 0; 0 0 1; 1 0 1; 1 1 1; 0 1 1]';
idx = [1 2 3 4 1 5 6 7 8 5 6 2 3 7 8 4];
vert(1,:) = vcube(1,:)*23;
vert(2,:) = vcube(2,:)*33;
vert(3,:) = vcube(3,:)*10;
x = vert(1,idx);
y = vert(2,idx);
z = vert(3,idx);
plot3(x,y,z,'k-');
view(160,30);
axis equal
pos = [10.18,12.1,5];
XX = [worldPoints zeros(64,1)]/12;
R = [-1 0 0; 0 0 -1; 0 -1 0];
T = [10.18+1.59193 0 5-0.27789];
YY = XX * R + ones(length(XX),1)*T;
colors = 'brgkcm';
N = size(XX,2);
n_sq_x = 7;
n_sq_y = 7;
kk=1;
YYx = zeros(n_sq_x+1,n_sq_y+1);
YYy = zeros(n_sq_x+1,n_sq_y+1);
YYz = zeros(n_sq_x+1,n_sq_y+1);
YYx(:) = YY(:,1);
YYy(:) = YY(:,2);
YYz(:) = YY(:,3);
hold on
hhh= mesh(YYx,YYy,YYz);
set(hhh,'edgecolor',colors(rem(kk-1,6)+1),'linewidth',1);
plot3(YY(1,1),YY(1,2),YY(1,3),'ro','LineWidth',2);
plot3(pos(1),pos(2),pos(3),'r*');
hold off
xlabel('x');
ylabel('y');
zlabel('z');
R = [0 1 0; 0 0 -1; -1 0 0];
T = [0 12.074-10.0599 5+1.75648];
kk = 2;
YY = XX * R + ones(length(XX),1)*T;
YYx(:) = YY(:,1);
YYy(:) = YY(:,2);
YYz(:) = YY(:,3);
hold on
hhh= mesh(YYx,YYy,YYz);
set(hhh,'edgecolor',colors(rem(kk-1,6)+1),'linewidth',1);
plot3(YY(1,1),YY(1,2),YY(1,3),'ro','LineWidth',2);
hold off
R = [0 -1 0; 0 0 -1; 1 0 0];
T = [23 12.074+1.75231 5+0.41953];
kk = 3;
YY = XX * R + ones(length(XX),1)*T;
YYx(:) = YY(:,1);
YYy(:) = YY(:,2);
YYz(:) = YY(:,3);
hold on
hhh= mesh(YYx,YYy,YYz);
set(hhh,'edgecolor',colors(rem(kk-1,6)+1),'linewidth',1);
plot3(YY(1,1),YY(1,2),YY(1,3),'ro','LineWidth',2);
hold off
R = [1 0 0; 0 0 -1; 0 1 0];
T = [10.18+4.24289 33 5+3.03199];
kk = 4;
YY = XX * R + ones(length(XX),1)*T;
YYx(:) = YY(:,1);
YYy(:) = YY(:,2);
YYz(:) = YY(:,3);
hold on
hhh= mesh(YYx,YYy,YYz);
set(hhh,'edgecolor',colors(rem(kk-1,6)+1),'linewidth',1);
plot3(YY(1,1),YY(1,2),YY(1,3),'ro','LineWidth',2);
hold off