Surface Demo 1
Contents
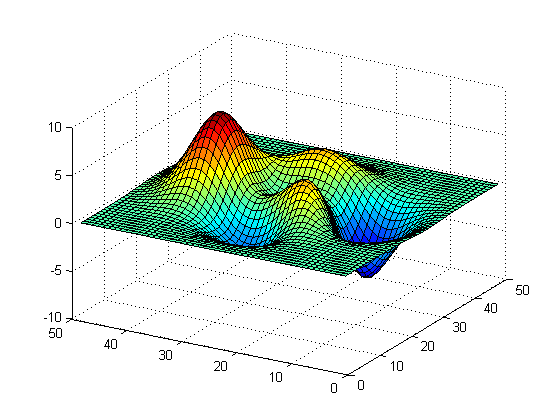
Example 1
surface(Z) plots the surface specified by the matrix Z. Here, Z is a single-valued function, defined over a geometrically rectangular grid.
close
surface(peaks)
view(-60,30)
grid on
Example 2
surface(Z,C) plots the surface specified by Z and colors it according to the data in C
close
clear
load clown;
rgb = ind2rgb(X,map);
imshow(rgb)
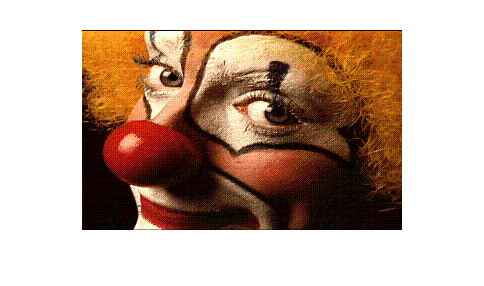
% add texture map
close
surface(peaks,flipdim(rgb,1),'FaceColor','texturemap','EdgeColor','none');
view(-35,25)
grid on

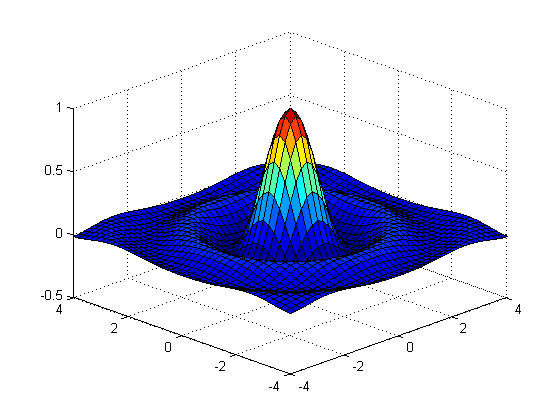
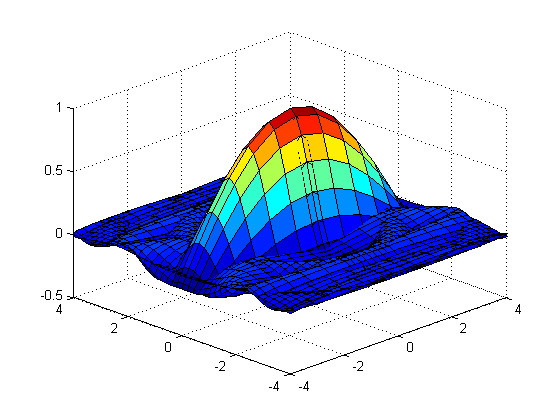
Example 3
surface(X,Y,Z,C) plots the parametric surface specified by X, Y, and Z, with color specified by C.
close
N = 41;
[xdata ydata] = meshgrid(linspace(-4,4,N),linspace(-4,4,N));
rdata = sqrt(xdata.^2+ydata.^2);
zdata = somb(rdata);

surface(xdata,ydata,zdata)
view(-45,30)
grid on
% make it more interesting
surface(4*sin(xdata),ydata,zdata)
Example 4
close
xdata = [0 1; 0 1];
ydata = [0 0; 0 0];
zdata = [0 0; 1 1];
rgb = imread('vis5.jpg');
rgb1 = flipdim(rgb,1);
rgb = imread('vis1.jpg');
rgb4 = flipdim(rgb,1);
h(1) = surface(xdata,ydata,zdata,rgb1,...
	'FaceColor','texturemap','EdgeColor','none');
ydata = [1 1; 1 1];
h(4) = surface(fliplr(xdata),ydata,zdata,rgb4,...
	'FaceColor','texturemap','EdgeColor','none');
axis square
grid on
view(-35,15)
