viewmtx example
Explore code from
Define vector that draws a cube
close all
clear
%          1      2      3      4      5      6      7      8
vcube = [ 0 0 0; 1 0 0; 1 1 0; 0 1 0; 0 0 1; 1 0 1; 1 1 1; 0 1 1]';
idx = [1 2 3 4 1 5 6 7 8 5 6 2 3 7 8 4];
vert(1,:) = vcube(1,:);
vert(2,:) = vcube(2,:);
vert(3,:) = vcube(3,:);

% These vectors trace the edges of a unit cube:
x = vert(1,idx);
y = vert(2,idx);
z = vert(3,idx);
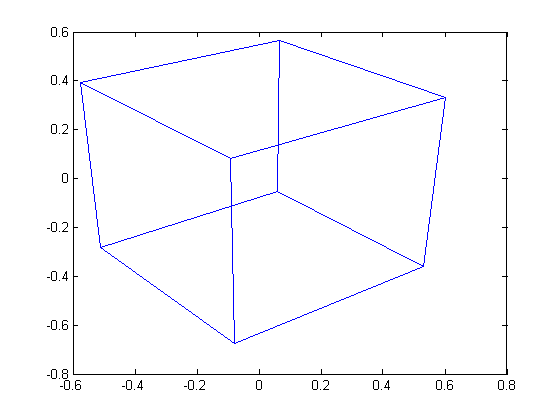
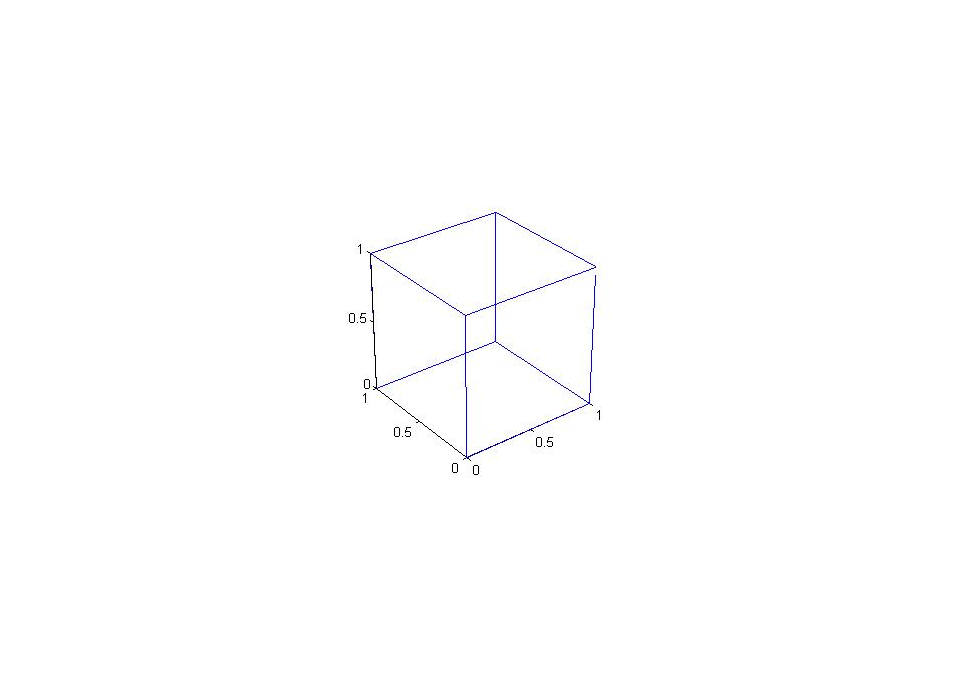
Transform the cube vectors to the screen and plot the object:
A = viewmtx(-37.5,30,25);
[m,n] = size(x);
x4d = [x(:),y(:),z(:),ones(m*n,1)]';
x2d = A*x4d;
x2 = zeros(m,n); y2 = zeros(m,n);
x2(:) = x2d(1,:)./x2d(4,:);
y2(:) = x2d(2,:)./x2d(4,:);
plot(x2,y2)
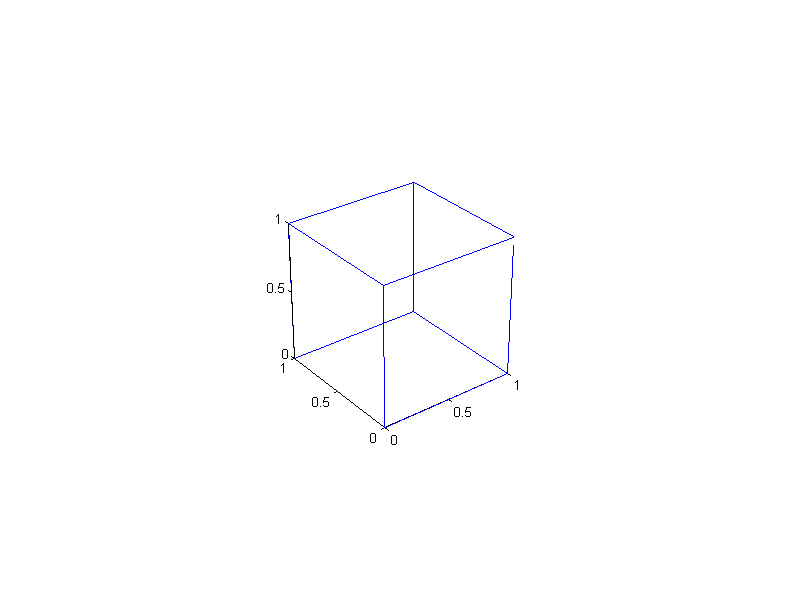
Use plot3 to display cube (same nominal parameters as above) save the plot as cube.eps
plot3(x,y,z);
view(-37.5,30);
camproj('perspective');
camva(25);
set(gcf,'Position',[300 200 800 600]);
set(gca,'Position',[0 0 1 1]);
v1 = get(gca,'CameraPosition');
fprintf('camera position: %g %g %g\n',v1);
v2 = get(gca,'CameraTarget');
fprintf('camera target: %g %g %g\n',v2);
camera position: -4.06571 -5.45015 4.83013
camera target: 0.5 0.5 0.5
view vs. viewmtx
T = viewmtx(-37.5,30)
view(-37.5,30);
M = view

% look at rotation matrices

R1 = T(1:3,1:3)
R2 = M(1:3,1:3)

fprintf('det(R1) %g det(R2) %g\n',det(R1),det(R2));

t1 = R1'*T(1:3,4)
t2 = R2'*M(1:3,4)

fprintf('camera position: %g %g %g\n',v1);
T =

    0.7934   -0.6088         0         0
    0.3044    0.3967    0.8660         0
   -0.5272   -0.6871    0.5000         0
         0         0         0    1.0000


M =

    0.7934   -0.6088         0   -0.0923
    0.3044    0.3967    0.8660   -0.7835
    0.5272    0.6871   -0.5000    8.3031
         0         0         0    1.0000


R1 =

    0.7934   -0.6088         0
    0.3044    0.3967    0.8660
   -0.5272   -0.6871    0.5000


R2 =

    0.7934   -0.6088         0
    0.3044    0.3967    0.8660
    0.5272    0.6871   -0.5000

det(R1) 1 det(R2) -1

t1 =

     0
     0
     0


t2 =

    4.0657
    5.4502
   -4.8301

camera position: -4.06571 -5.45015 4.83013
now perspective
az = -37.5;
el = 30;
phi = 25;
T = viewmtx(-37.5,30,25)
f = sqrt(2)/2/+tan(phi*pi/360);
P = [ 1 0 0 0; 0 1 0 0; 0 0 1 0; 0 0 -1/f 1];
test = inv(P)*T
T =

    0.7934   -0.6088         0   -0.0923
    0.3044    0.3967    0.8660   -0.7835
   -0.5272   -0.6871    0.5000   -0.5089
    0.1653    0.2154   -0.1568    1.1595


test =

    0.7934   -0.6088         0   -0.0923
    0.3044    0.3967    0.8660   -0.7835
   -0.5272   -0.6871    0.5000   -0.5089
         0         0         0    1.0000
work through matrix
R = T(1:3,1:3);
% Transformation to move origin of object coordinate system to TARGET
pos = campos
O1 = [eye(4,3),[-pos';1]];

R = [R [0 0 0]'; [0 0 0 1]]
T = P*R*O1

el = el*pi/180;
az = az*pi/180;
% default target calculation (in viewmtx)
default_target = 0.5 + sqrt(3)/2*[cos(el)*sin(az);-cos(el)*cos(az);sin(el)]
pos =

   -4.0657   -5.4502    4.8301


R =

    0.7934   -0.6088         0         0
    0.3044    0.3967    0.8660         0
   -0.5272   -0.6871    0.5000         0
         0         0         0    1.0000


T =

    0.7934   -0.6088         0   -0.0923
    0.3044    0.3967    0.8660   -0.7835
   -0.5272   -0.6871    0.5000   -8.3031
    0.1653    0.2154   -0.1568    3.6032


default_target =

    0.0434
   -0.0950
    0.9330
pts = [v2 1];
pt = T*pts'
x0 = pt(1)/pt(4);
y0 = pt(2)/pt(4);
z0 = pt(3)/pt(4);
fprintf('transformed target %f %f %f\n',x0,y0,z0);
fprintf('focal length %g\n',f);
pt =

   -0.0000
    0.0000
   -8.6603
    3.7152

transformed target -0.000000 0.000000 -2.331037
focal length 3.18955
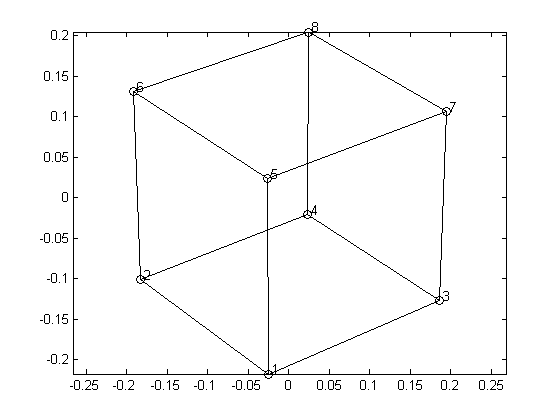
A = [x' y' z' ones(length(x),1)];
htpts = T*A';
x3 = htpts(1,:)./htpts(4,:);
y3 = htpts(2,:)./htpts(4,:);
z3 = htpts(3,:)./htpts(4,:);
close all
plot(x3,y3,'k');
axis equal

% get points on edge of cube
verts = unique(A,'rows');
%verts = [verts ones(length(verts),1)];
[B ix] = sort(verts(:,3));
B = verts(ix,:);

htpts = T*B';
xpts = htpts(1,:)./htpts(4,:);
ypts = htpts(2,:)./htpts(4,:);
zpts = htpts(3,:)./htpts(4,:);

disp([xpts' ypts' zpts'])

hold on
plot(xpts,ypts,'ko');
axis equal

xo = 0.005;
yo = 0.005;
for n=1:8
    str = sprintf('%d',n);
    text(xpts(n)+xo,ypts(n)+yo,str);
end
hold off
   -0.0256   -0.2175   -2.3044
   -0.1836   -0.1013   -2.3543
    0.1860   -0.1271   -2.3432
    0.0232   -0.0207   -2.3889
   -0.0268    0.0239   -2.2641
   -0.1914    0.1309   -2.3185
    0.1941    0.1071   -2.3064
    0.0241    0.2047   -2.3562
rgb = imread('cube.jpg');
[ny nx nz] = size(rgb);
fprintf('image size %g %g\n',nx,ny);
imshow(rgb)
image size 800 600
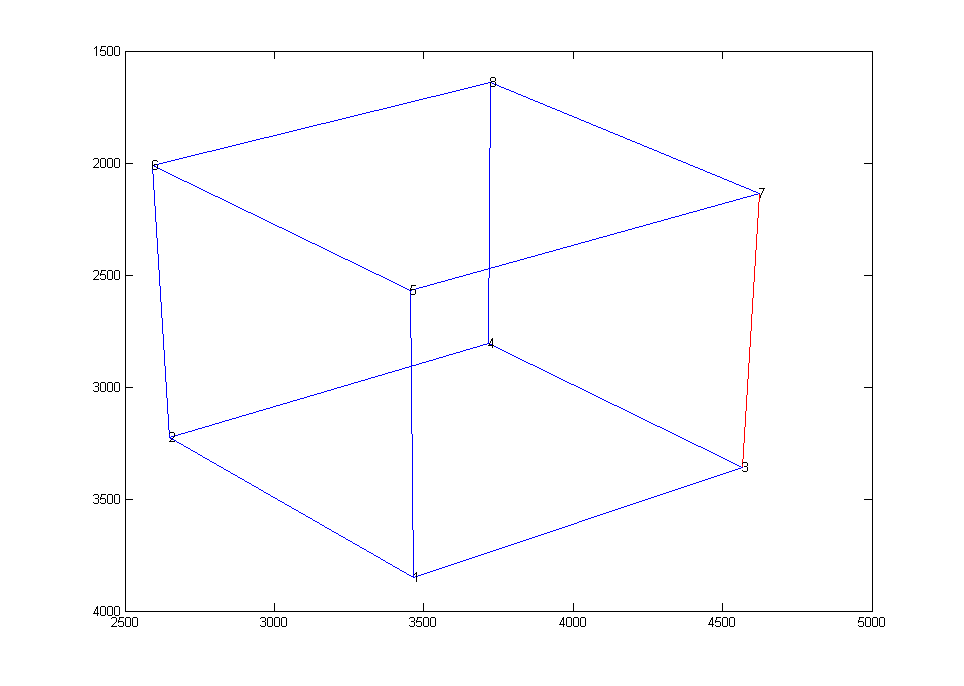
cube data obtained from *.eps file
% there are only 12 unique rows
load cube
plot([data(1,1) data(1,3)],[data(1,2) data(1,4)],'r')
hold on
for n=2:15
plot([data(n,1) data(n,3)],[data(n,2) data(n,4)])
end
hold off
axis ij

% get unique points of cube
pt = [data(:,1) data(:,2)];
pts = flipud(unique(pt,'rows'));
% arrange in same order as starting points (xpts, ypts)
ix = [5 7 2 4 6 8 1 3];
spts = pts(ix,:)

for n=1:length(spts)
    str = sprintf('%d',n);
    text(spts(n,1),spts(n,2),str);
end
spts =

        3464        3849
        2649        3224
        4566        3360
        3717        2805
        3455        2571
        2593        2012
        4624        2134
        3724        1641
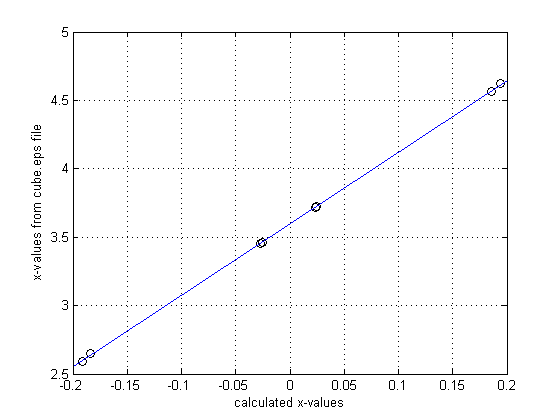
look at pixel scale between plot3 pixel values and our calculated values
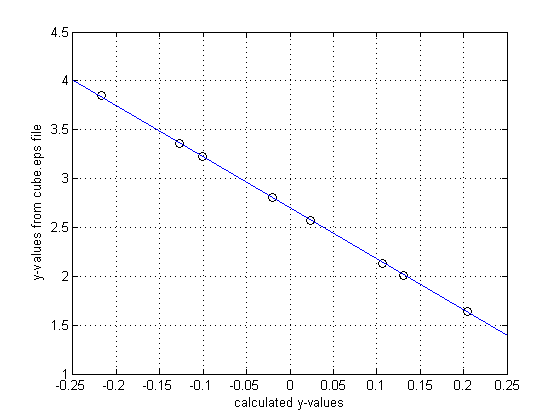
scl = 1000;
cx = polyfit(xpts',spts(:,1)/scl,1)
cy = polyfit(ypts',spts(:,2)/scl,1)

close all
xr = [-0.2 0.2];
plot(xpts,spts(:,1)/1000,'ko',xr,polyval(cx,xr));
grid
xlabel('calculated x-values');
ylabel('x-values from cube.eps file');
figure
xr = [-0.25 0.25];
plot(ypts,spts(:,2)/1000,'ko',xr,polyval(cy,xr));
grid
xlabel('calculated y-values');
ylabel('y-values from cube.eps file');
cx =

    5.2291    3.5990


cy =

   -5.2303    2.6995
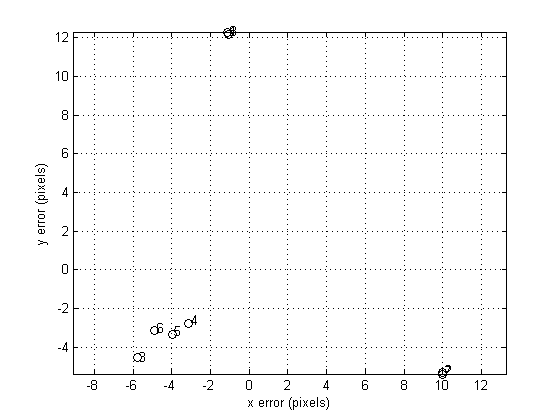
xfit = polyval(cx,xpts');
yfit = polyval(cy,ypts');
xd = spts(:,1)-xfit*scl;
yd = spts(:,2)-yfit*scl;
plot(xd,yd,'ko')
grid;
axis equal
xlabel('x error (pixels)');
ylabel('y error (pixels)');
dm = 0.2;
for n=1:8
    str = sprintf('%d',n);
    text(xd(n)+dm*rand,yd(n)+dm*rand,str);
end
maxerr = squeeze(max([xd; yd]));
fprintf('maxerror %e\n',maxerr);
maxerror 1.229105e+01