test convolutions
Contents
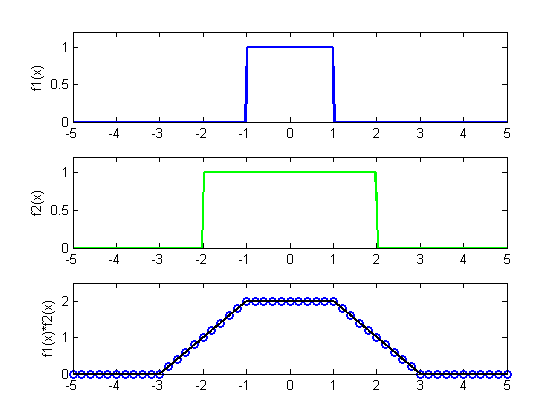
example 1
trap = rect(x/a)*rect(x/b)
ax = [-5 5 0 1.2];
x = linspace(-5,5,501);
dx = x(2)-x(1);
a = 2;
b = 4;
f1 = rect(x,a);
f2 = rect(x,b);
g3 = convn(f1,f2,'same')*dx;
gt = trap(x,a,b);
subplot(3,1,1);
plot(x,f1,'b','LineWidth',2);
ylabel('f1(x)');
axis(ax);
subplot(3,1,2);
plot(x,f2,'g','LineWidth',2);
ylabel('f2(x)');
axis(ax);
subplot(3,1,3);
idx = 1:10:501;
plot(x(idx),gt(idx),'bo',x,g3,'k','LineWidth',2);
ylabel('f1(x)*f2(x)');
ax(4)=min(a,b)+0.5;
axis(ax);
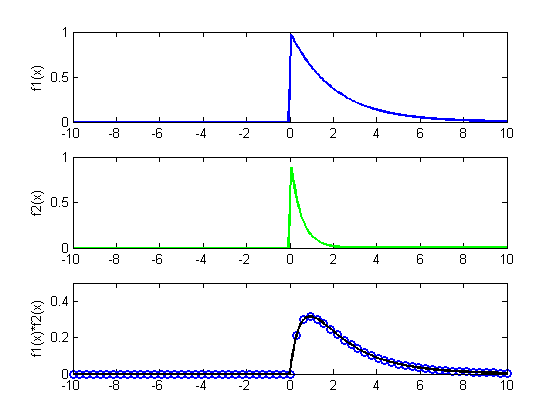
example 2
exp(-ax)u(x) * exp(-bx)u(x)
ax = [-10 10 0 1];
a = 0.5;
b = 2;
x = linspace(ax(1),ax(2),321);
dx = x(2)-x(1);
f1 = exp(-a*x).*ustep(x);
f2 = exp(-b*x).*ustep(x);
if (a==b)
    gt = x.*exp(-a*x).*ustep(x);
else
    gt = (exp(-b*x)-exp(-a*x))/(a-b).*ustep(x);
end
g3 = convn(f1,f2,'same')*dx;
subplot(3,1,1);
plot(x,f1,'b','LineWidth',2);
ylabel('f1(x)');
axis(ax);
subplot(3,1,2);
plot(x,f2,'g','LineWidth',2);
ylabel('f2(x)');
axis(ax);
subplot(3,1,3);
plot(x(1:5:321),gt(1:5:321),'bo',x,g3,'k','LineWidth',2);
ylabel('f1(x)*f2(x)');
ax(4)=0.5;
axis(ax);